
With the model merge feature, it is now possible for users to merge models which are created or managed by different users within a workspace. This facilitates ease of maintenance as large models can be broken down and managed separately, thereby, ensuring ease in connected planning.
Consider a firm that wants to review hundreds of product categories in the portfolio across geographies. Repeating a P&L statement for each product category leads to a model with several thousands of nodes. It would be easier for the product category/region managers to create and update the profit and loss statement for their respective model and then have it consolidated for the executives interested in the overall P&L statement.
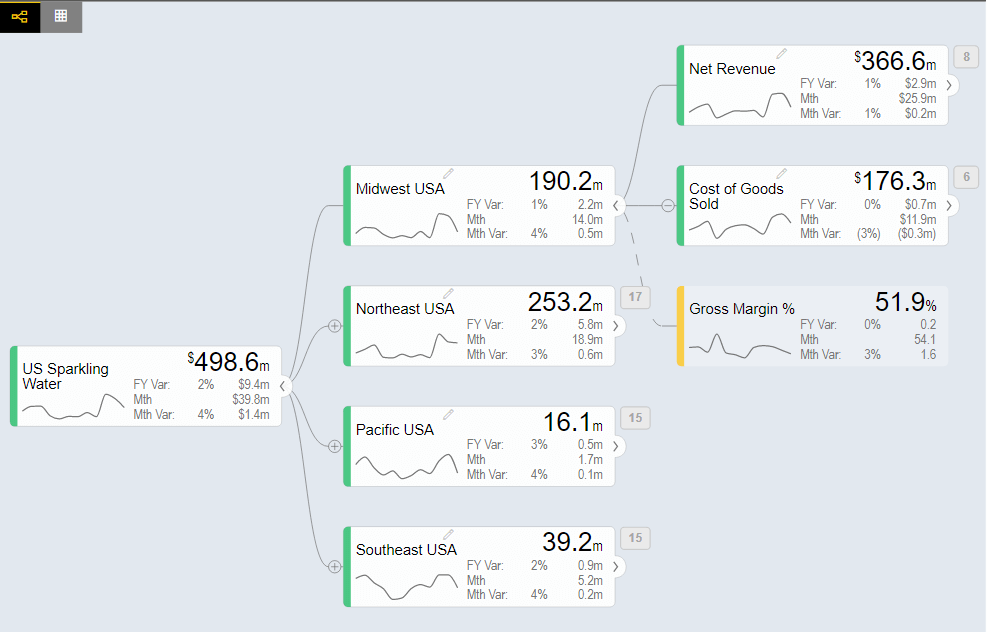
Let us take a look at an example. In the image below, P&L is visualized for Sparkling Water across four regions in the United States. This model is saved as ‘US Sparkling Water’ in the workspace for this example.
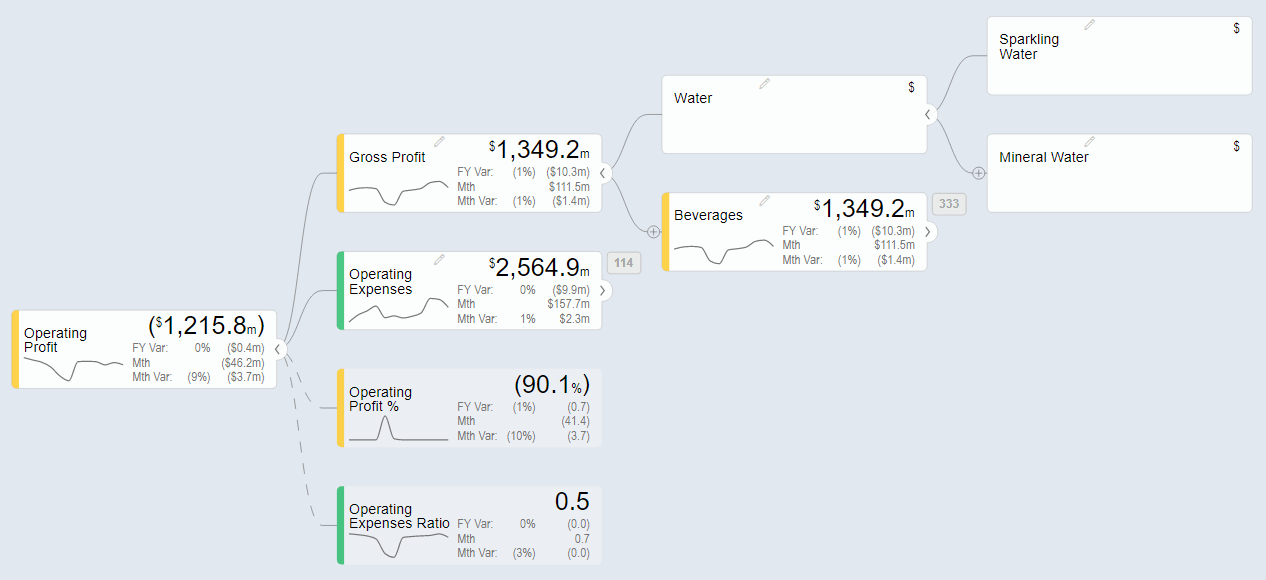
Let us see how to use this model in the overall P&L model. It is to be noted that the overall P&L model should also be saved in the same workspace. In the below image, you can see the node Sparkling Water.
1) To add the US P&L, first go to the model tab and create a child node under Sparkling Water.
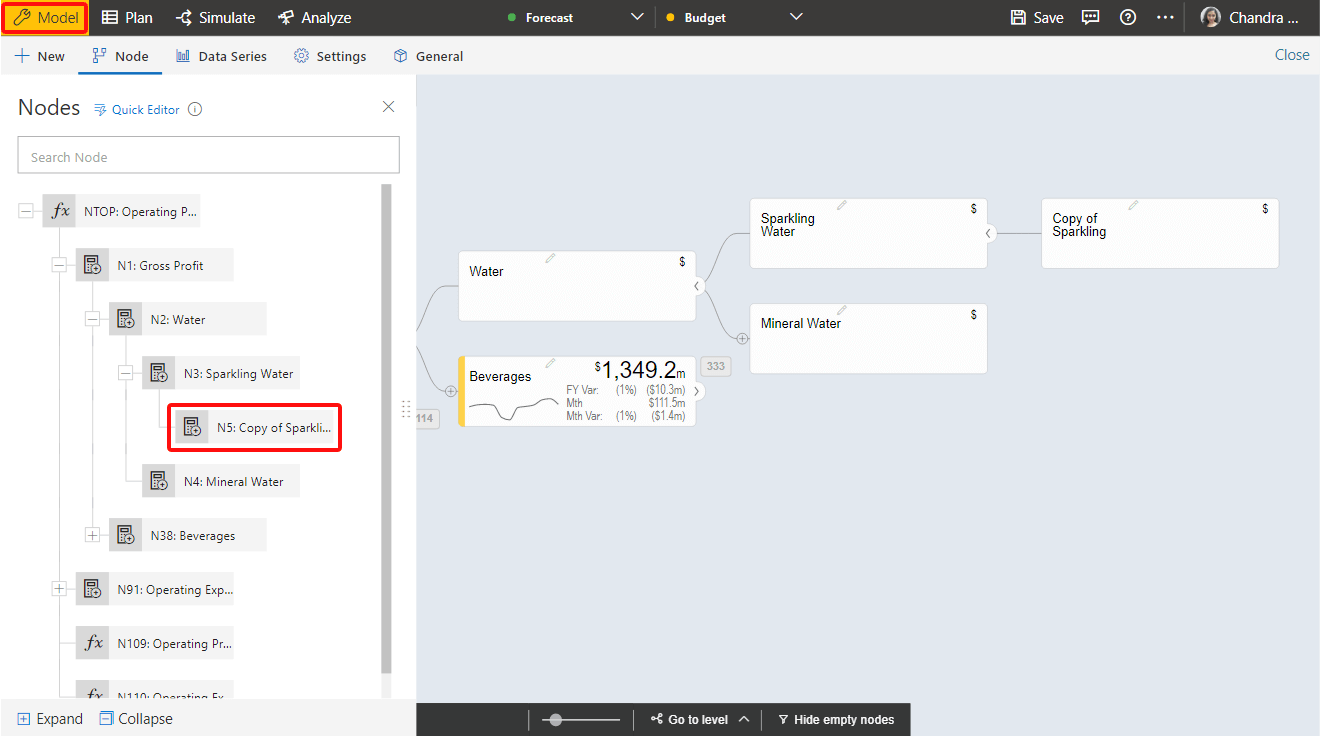
2) Double click on the node and rename it as shown below.
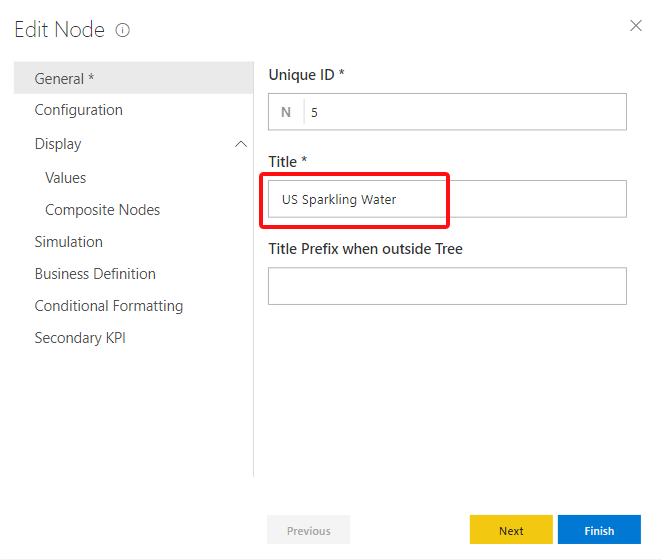
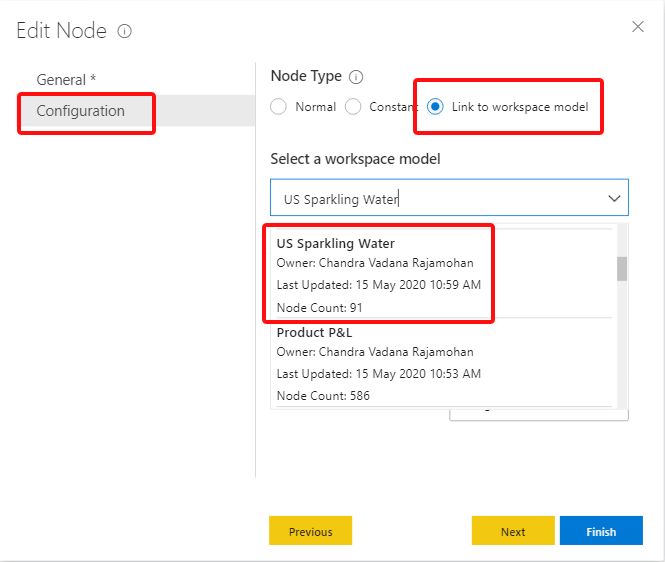
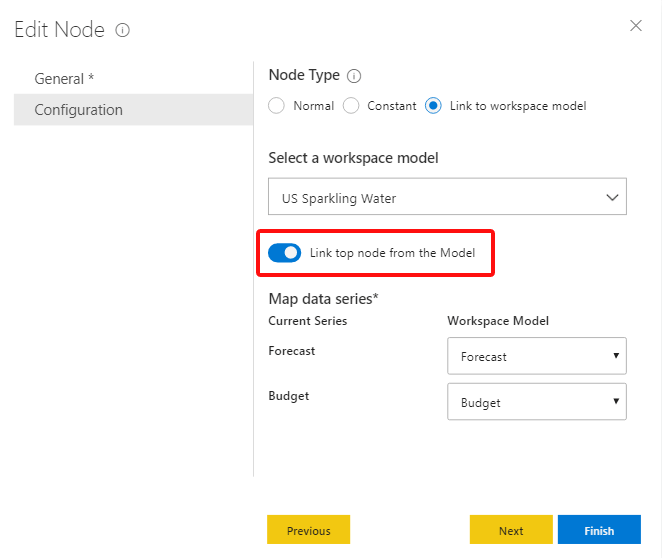
3) In the Configuration section, select ‘Node Type’ as ‘Link to workspace model’ and select ‘US Sparkling Water’ as the workspace model. Note: All the models that are to be merged should be updated to the latest version i.e. ValQ Collaborate 1.7 before using this functionality.
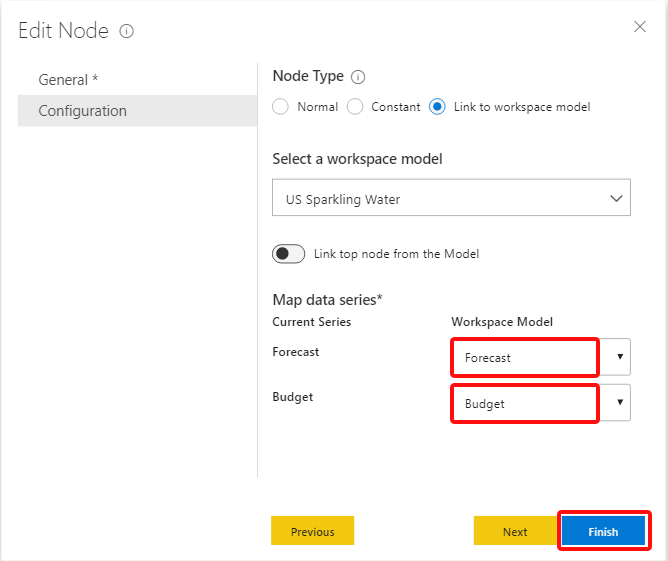
4) Select the data series as shown and click ‘Finish’.
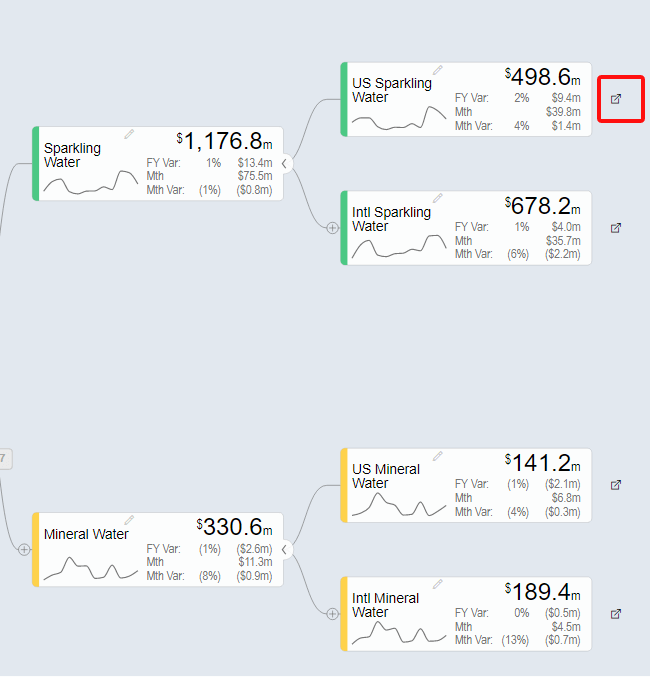
5) You would be able to see the values as shown below.
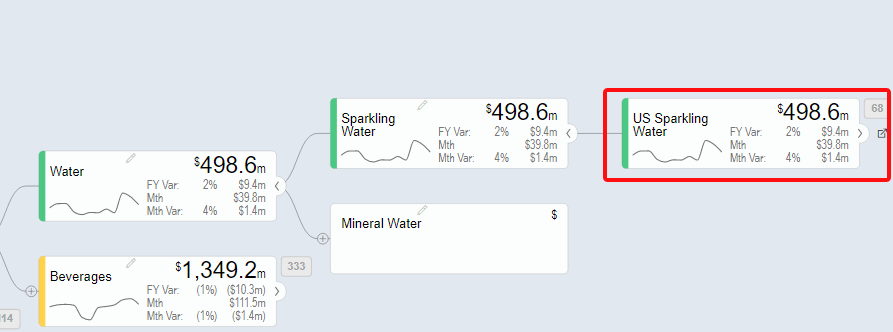
6) The nodes that are independent models are differentiated by the icon as shown in the image.

7) On clicking the icon, you will be able to view the US Sparkling Water model.

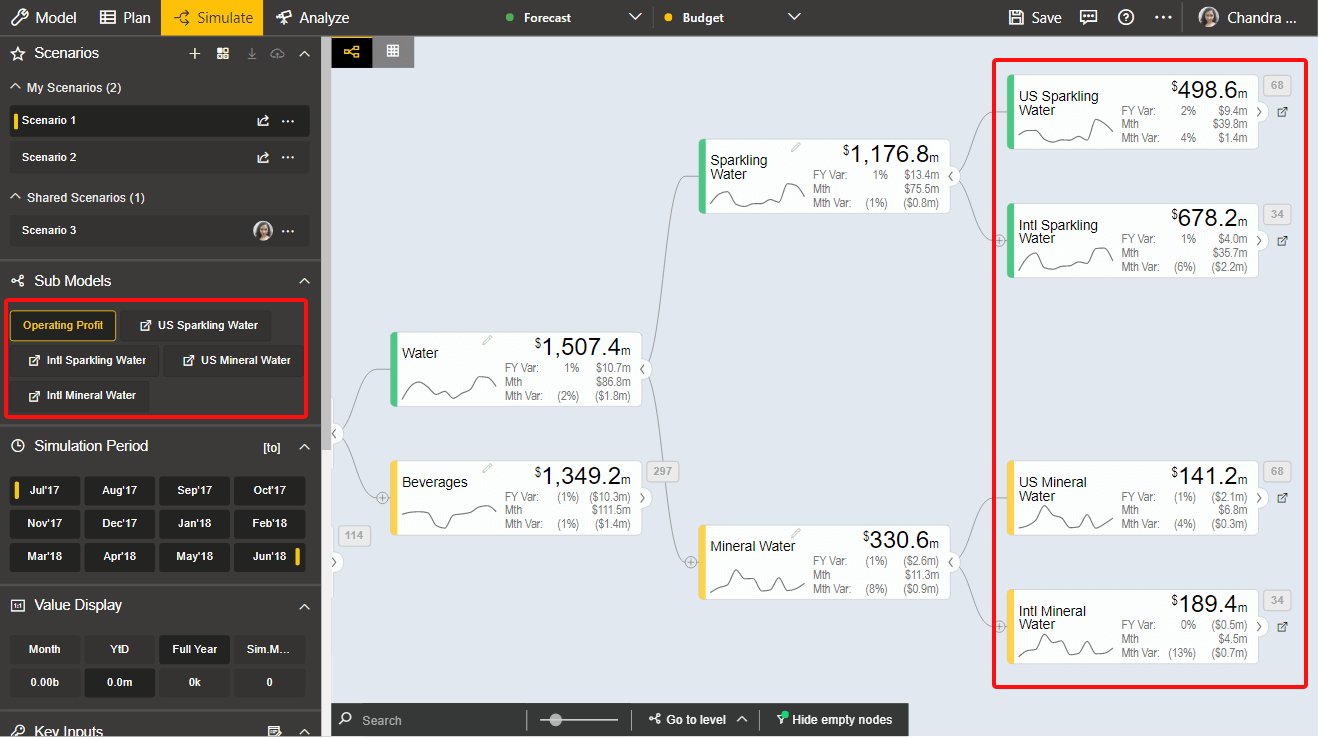
8) To go back to the overall model, click on ‘Operating Profit’ in the ‘Sub Models’ section.

9) Using the same steps, Sparkling Water and Mineral Water can be completed as shown below. These models get automatically added to the Sub Models section in the Navigation Panel.
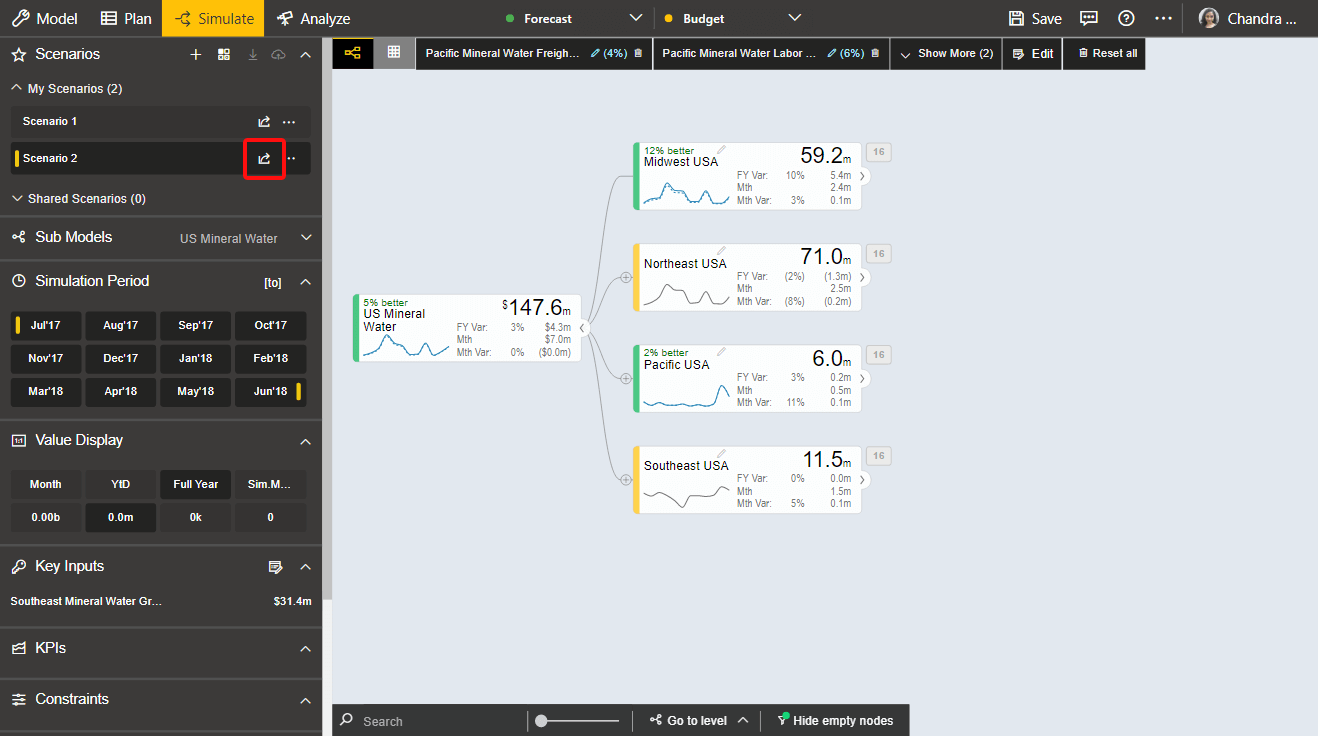
10) Let us assume the manager responsible for US Mineral Water has created a scenario and wants to view the created scenario in the overall model. To use scenario 2, it is necessary to first share this scenario with all the users in the workspace. Click on the ‘Share’ option next to it.
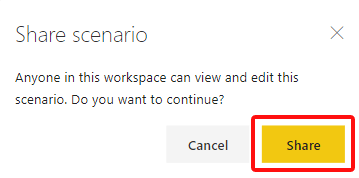
11) Click on the ‘Share’ option.
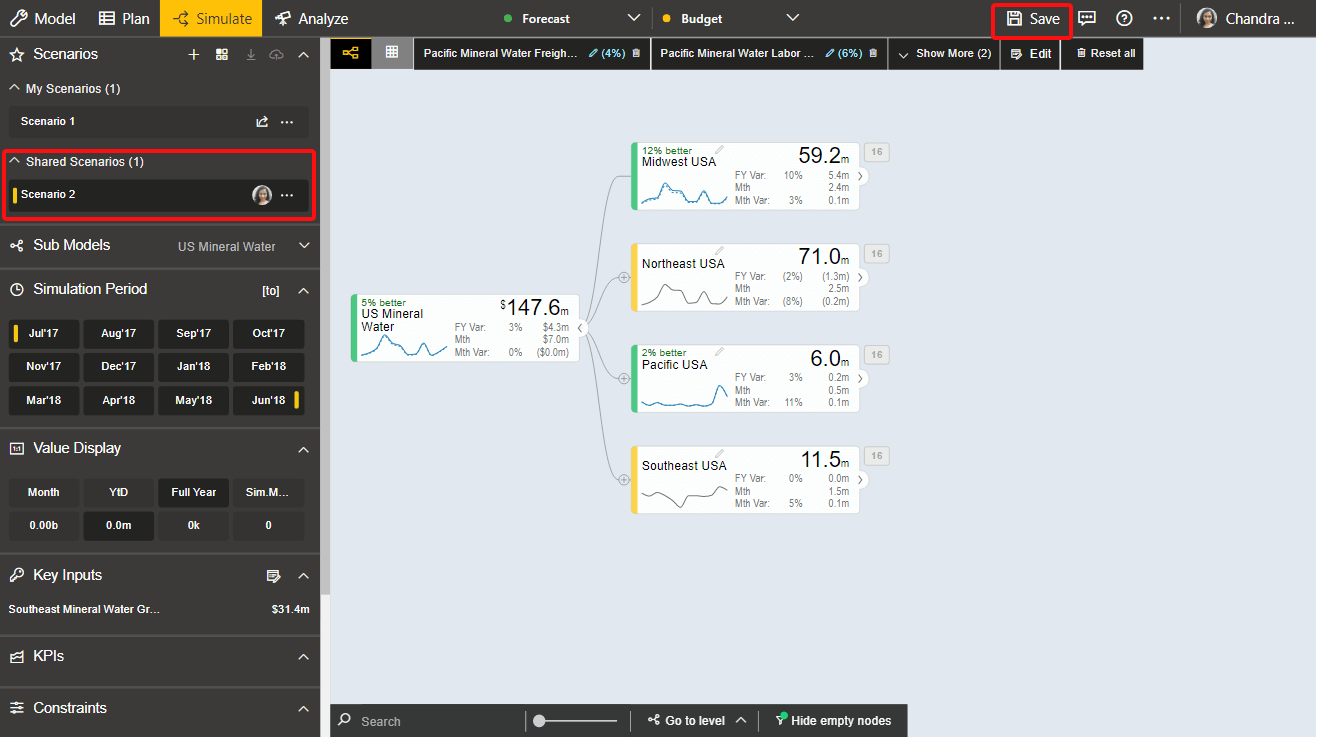
12) Scenario 2 will be available under the Shared Scenarios section. Click on ‘Save’.
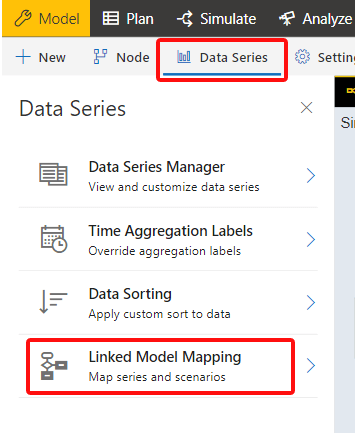
13) In the overall model, go to the ‘Model’ tab and select ‘Data Series’. Select the ‘Linked Model Mapping’ option.
14) You will see the following screen. In the ‘Map Series’ section, you can see the series that were selected for each of the models. You can make changes if desired by clicking on the dropdown.

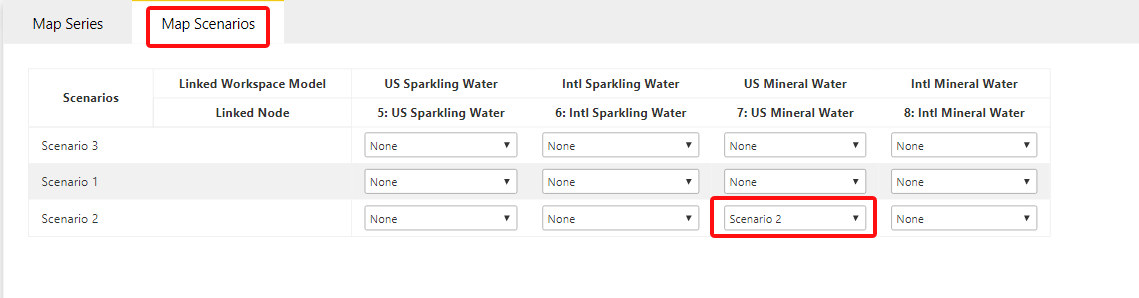
15) To map scenarios, click on the ‘Map Scenarios’ tab. In the US Mineral Water section, select ‘Scenario 2’ as shown. This way, in scenario 2 of the overall model, scenario 2 of the US Mineral Water model will be mapped.
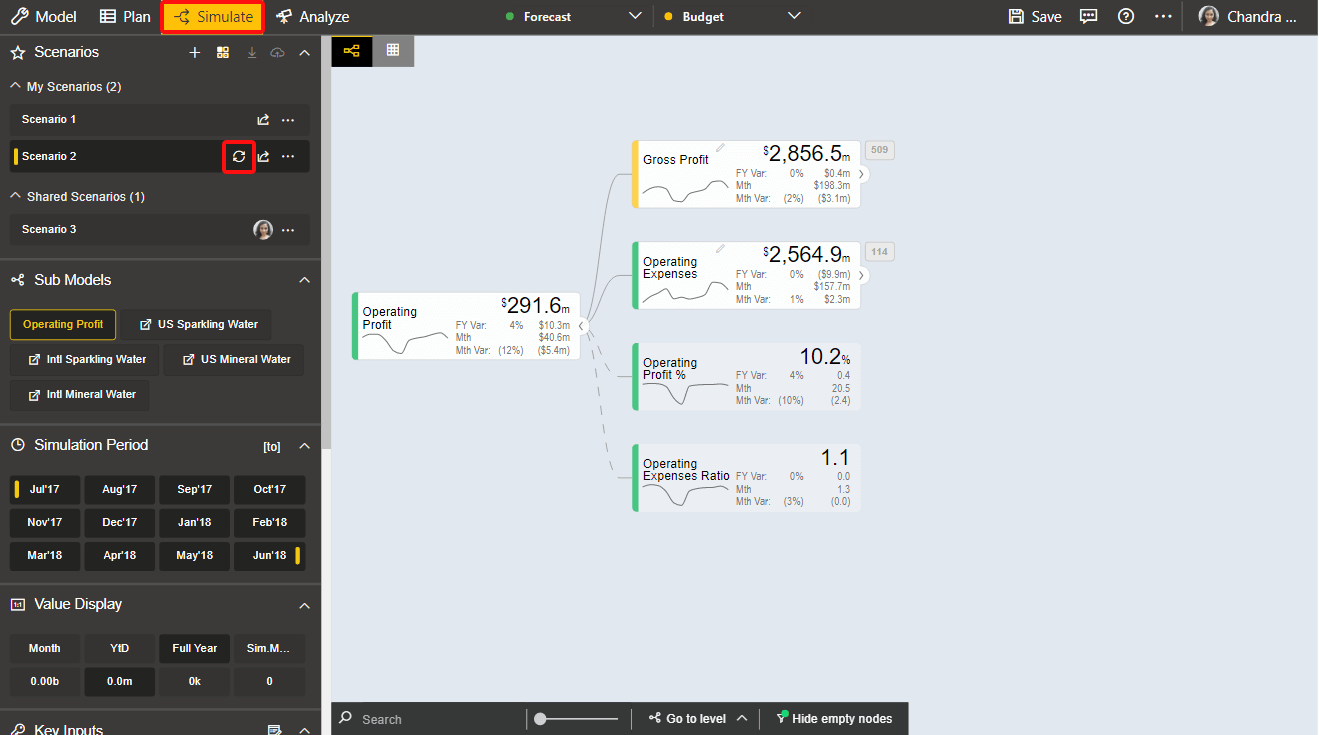
16) Go to the ‘Simulate’ tab, next to Scenario 2 you will find a ‘Refresh’ icon. Click on it.
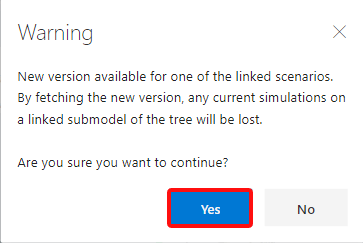
17) You will see the following warning. Click ‘Yes’.
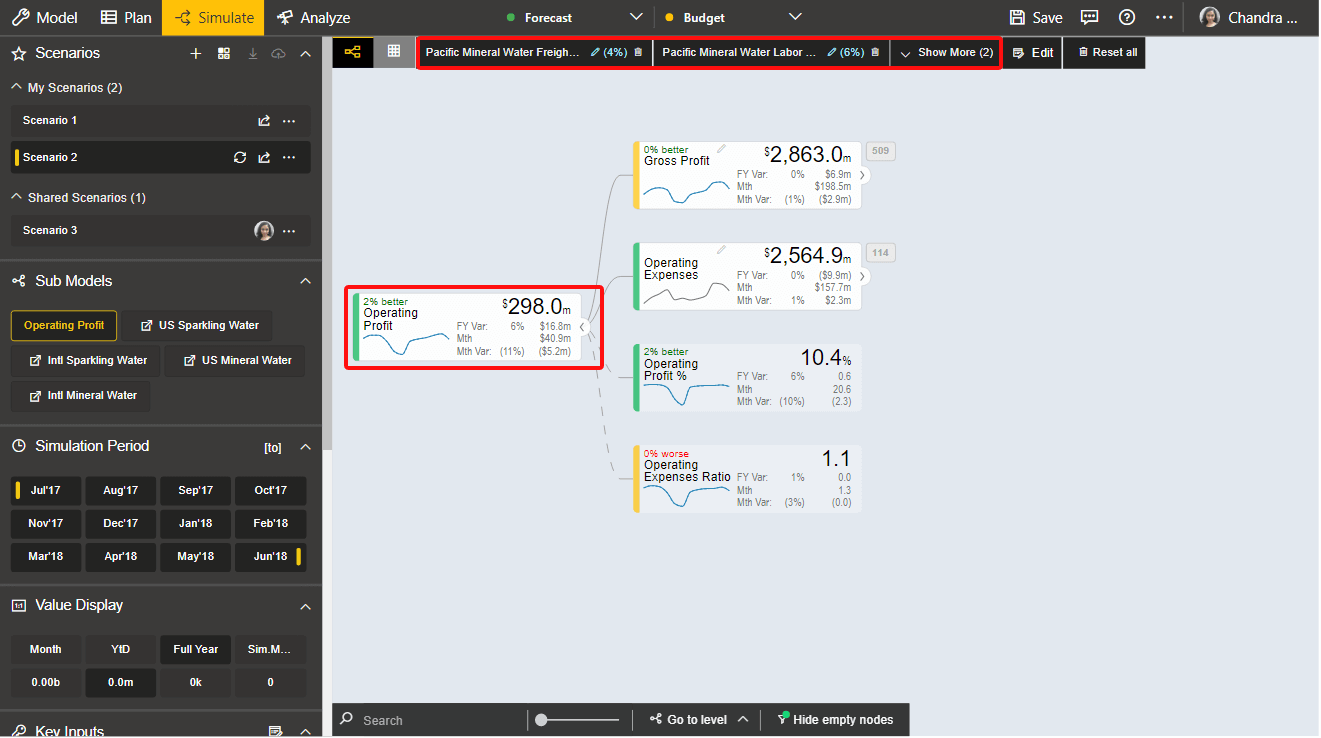
18) You will see the following screen. Notice the simulations on the top header and the updated values in the visual.
19) If only the top nodes are needed in the overall model, you can turn on the ‘Link top node from the Model’ option in the ‘Configuration’.
20) Once selected, clicking on the icon does not have any effect. It should be noted that mapping scenarios is not supported when only the top node is linked.
Note:
It is recommended to maintain a good naming convention for the models for easy understanding and a smooth workflow.
Thus, ValQ’s model merge feature, enables a smooth connected planning especially when we deal complex models.
Download the latest version here and get started with ValQ today.


