
Note: This feature is no longer available
With the latest release – ValQ 2.0, we are introducing the much-awaited feature – Sensitivity Analysis.
Sensitivity analysis in a financial model determines how target variables are affected based on changes in other variables known as input variables. It is a way to predict the outcome of a decision given a certain range of variables.
In this new update, the Sensitivity Analysis is visualized as a Tornado Chart. This helps in identifying the selected input nodes that have a major impact on the output node . This in turn would be useful to focus only on those components that can be used to optimize the KPIs.
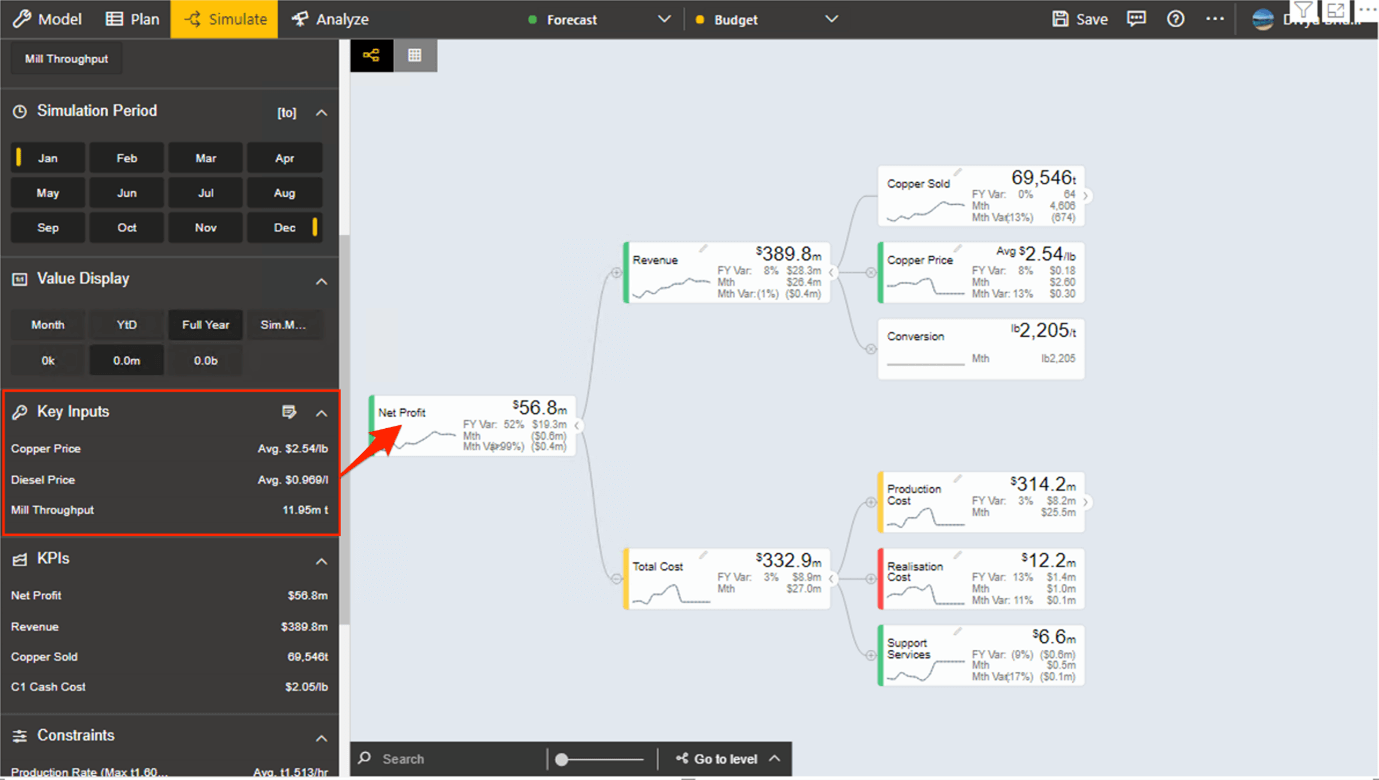
Consider a Financial Model here, with Copper Price, Diesel Price and Mill Throughput as its KPIs impacting its Net Profit.
In this blog, let’s look at the steps on performing Sensitivity Analysis in ValQ to analyse this impact :
1. Select ‘Sensitivity Analysis’ from the Analyze Tab.
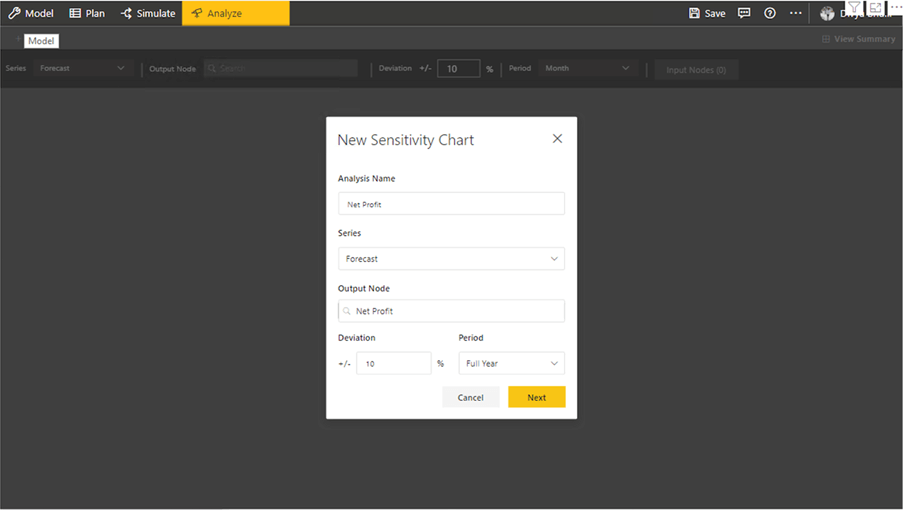
2. Here, when you choose “New Tab” on the screen displayed, a pop up screen will open.
You can rename your analysis, choose the series and select the output node. The deviation percentage of the output node and the period of analysis can also be chosen here.
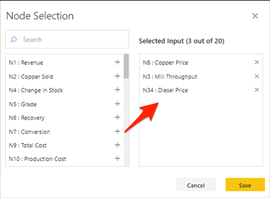
3.Then to select the input nodes, click on the ‘Select Input Nodes’ option and a panel for node selection will open. Here, the required child nodes that have an impact on the parent can be selected. Select ‘Save’ once you are done with the selections.
A tornado chart showing the sensitivity of each item is displayed. If you hover over any of the KPIs , the details of each of the KPIs and their impact on the ‘Net Profit’ will be shown. With the help of ‘New Tab’ you can create multiple analyses.
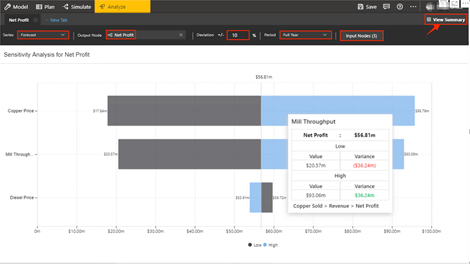
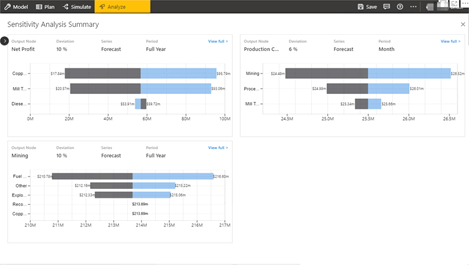
After adding a New Analysis, click ‘View Summary’. This shows a consolidated view of all the analyses made in the model.
To know more about the exciting features in ValQ 2.0, check out our blogs here.
Download the latest version here and get started with ValQ today.


