
Do you know that there is an option to perform Time Series Forecasting seamlessly in Microsoft Power BI? This innovative option does not require you to leverage or integrate R or Python? Learn more about how you can auto-forecast from historical data in less than 5 minutes.
ValQ for Microsoft Power BI delivers various time-series forecasting methods such as Linear Trend, Moving Average, and Weighted Moving Average methods.
It even sports an auto forecast capability to support users unfamiliar or intimidated with various time-series forecasting methods and algorithms. This lets users visualize recommended various forecast outcomes and choose one that they find most appropriate for their data.
Highlights of the forecasting capabilities include:
1. Fully independent and self-sufficient – No external resources or integrations required (with R, Python, scripts etc.)
2. Choice of multiple forecasting methods, including auto-forecasts for casual users
3. Analyze historical trends and forecast at any level of granularity – company-level, category or subcategory
4. Configurable ranges for past & future periods, with options to allocate weightage as required
5. Visualize & preview forecast outputs before you apply them
6. Ability to adjust and edit forecasts after they have been created (through an editable table interface)
7. Perform time series forecasting + demand planning / financial planning/operations planning from a single interface
* * *
Performing Time Series Forecasts – Step by Step Instructions
Let us take the example of a consumer goods manufacturer selling hair care products in four (4) different regions. We have historic data for three (3) years, using which we would prepare a time-series forecast for 2020.
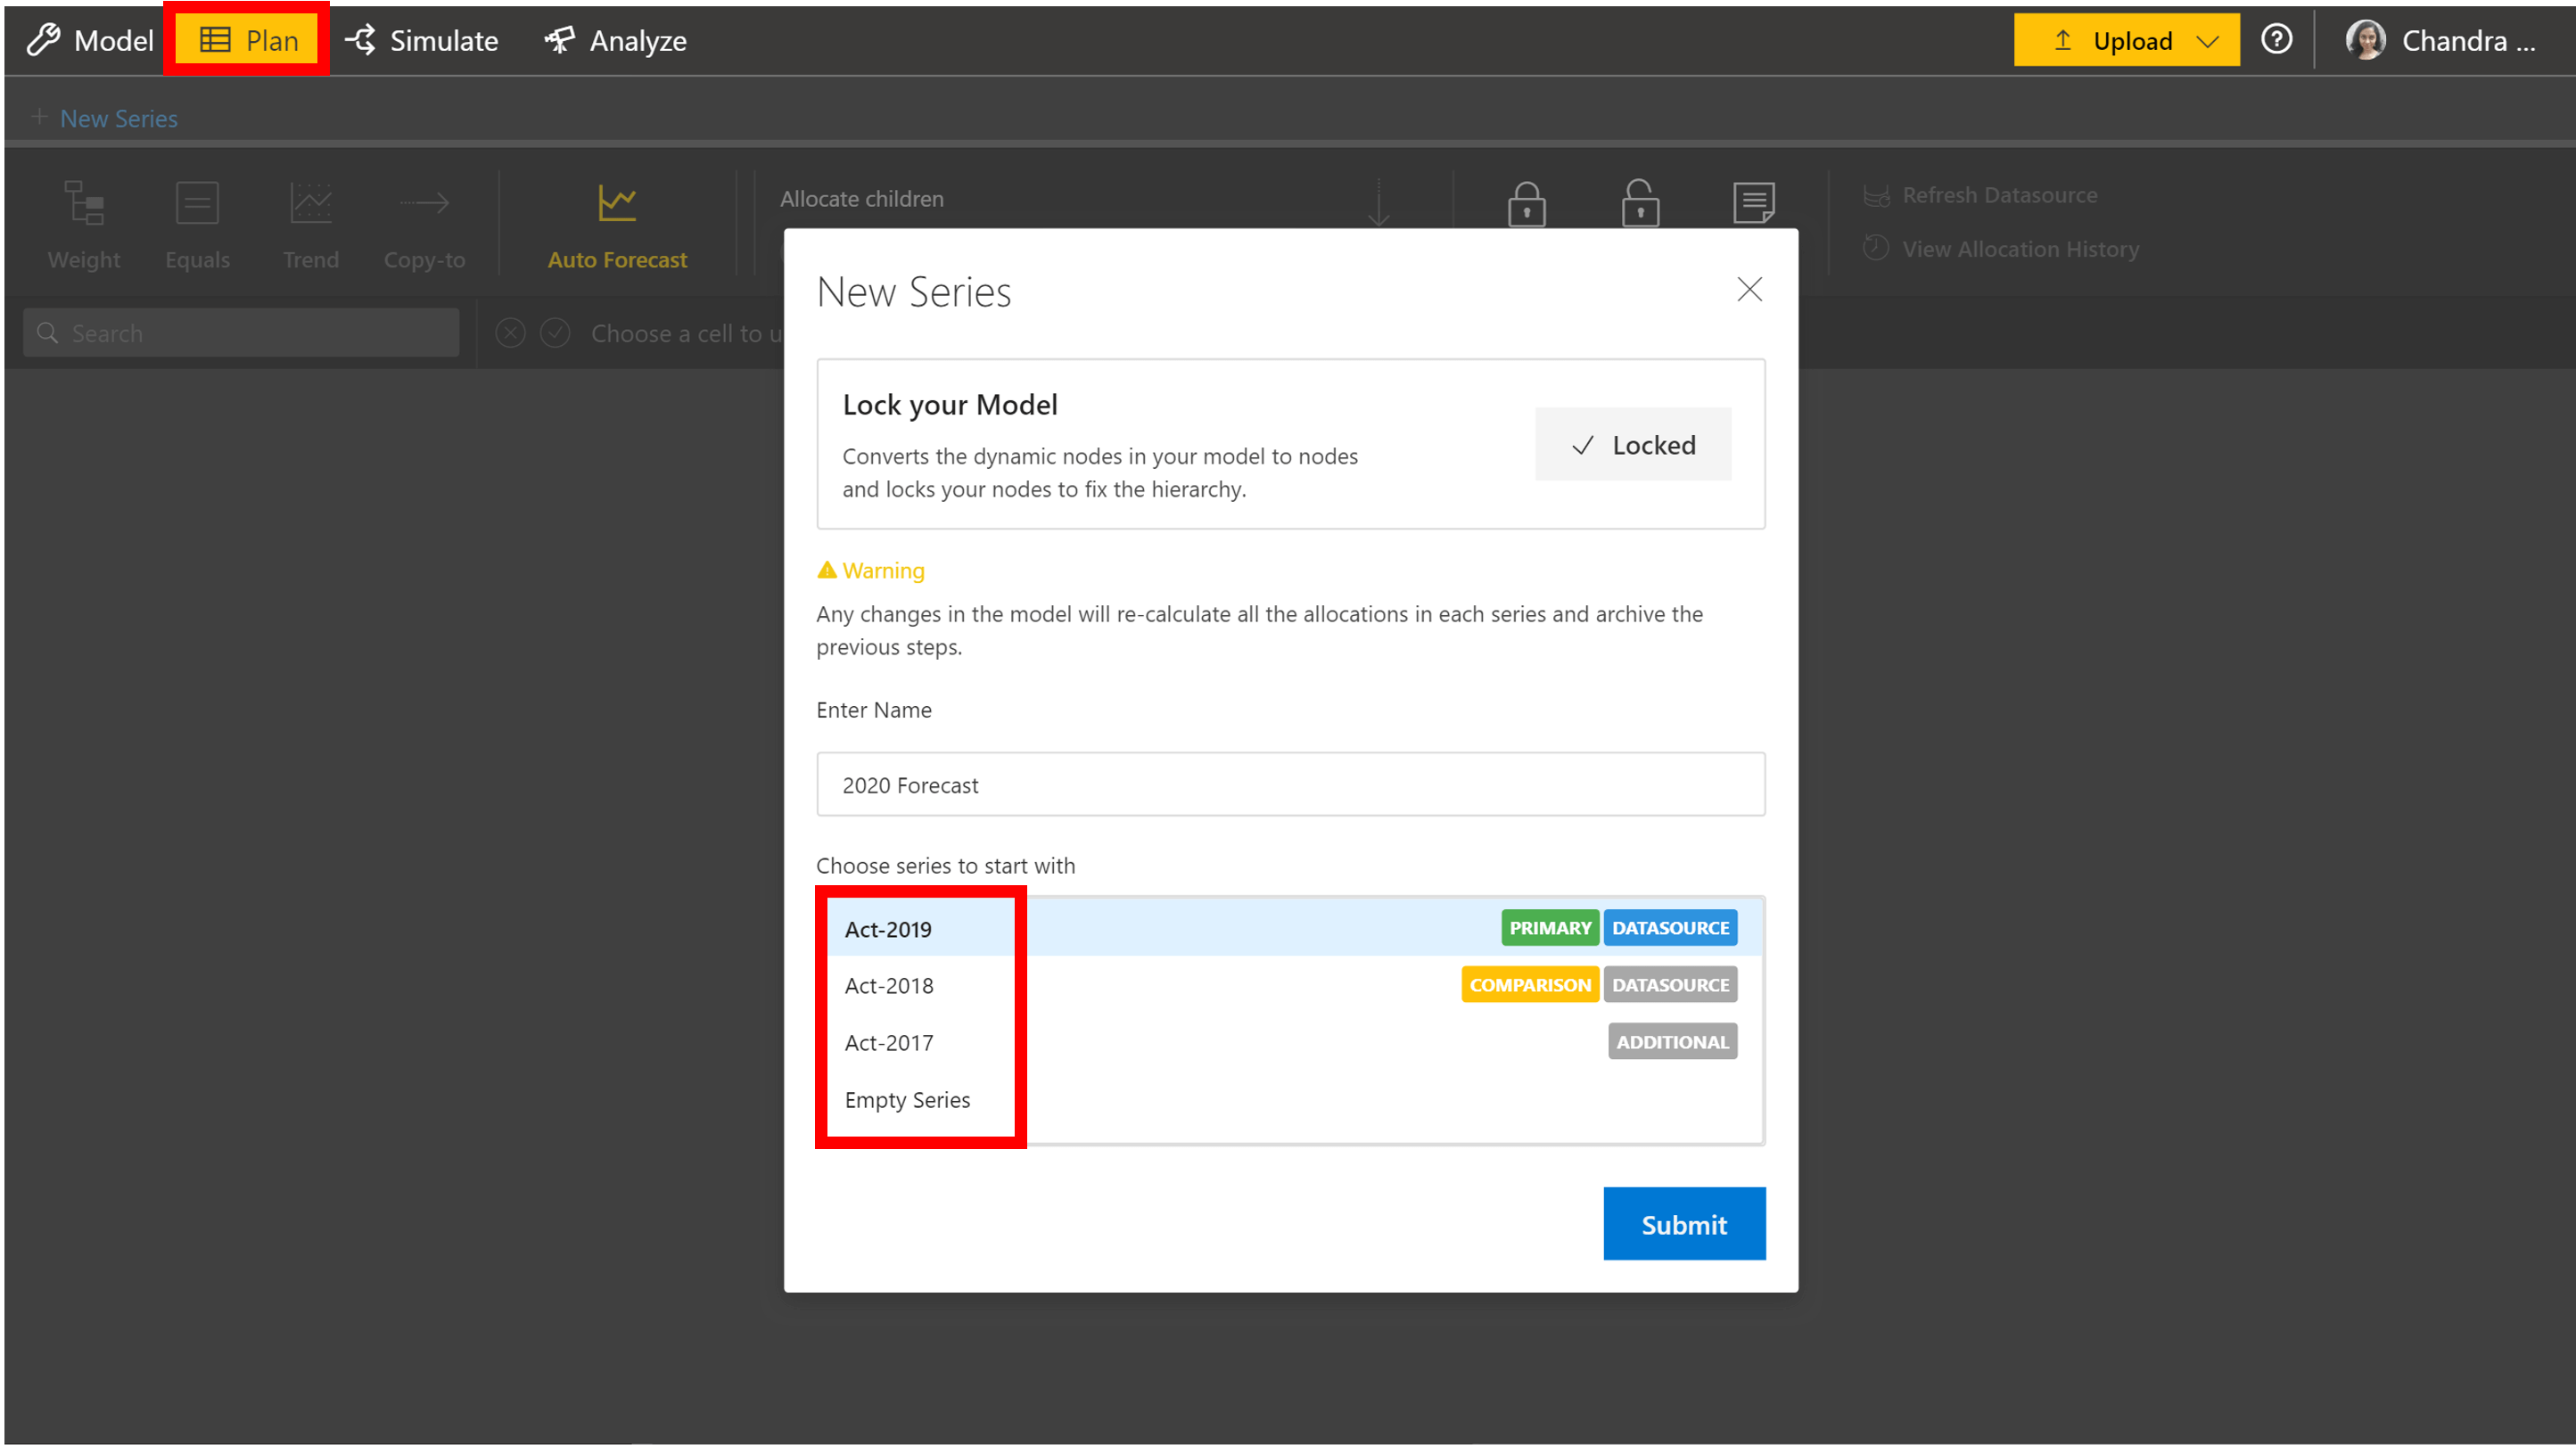
1. Go to the ‘Plan’ tab. You can either start off with the most recent actuals or with a blank template.
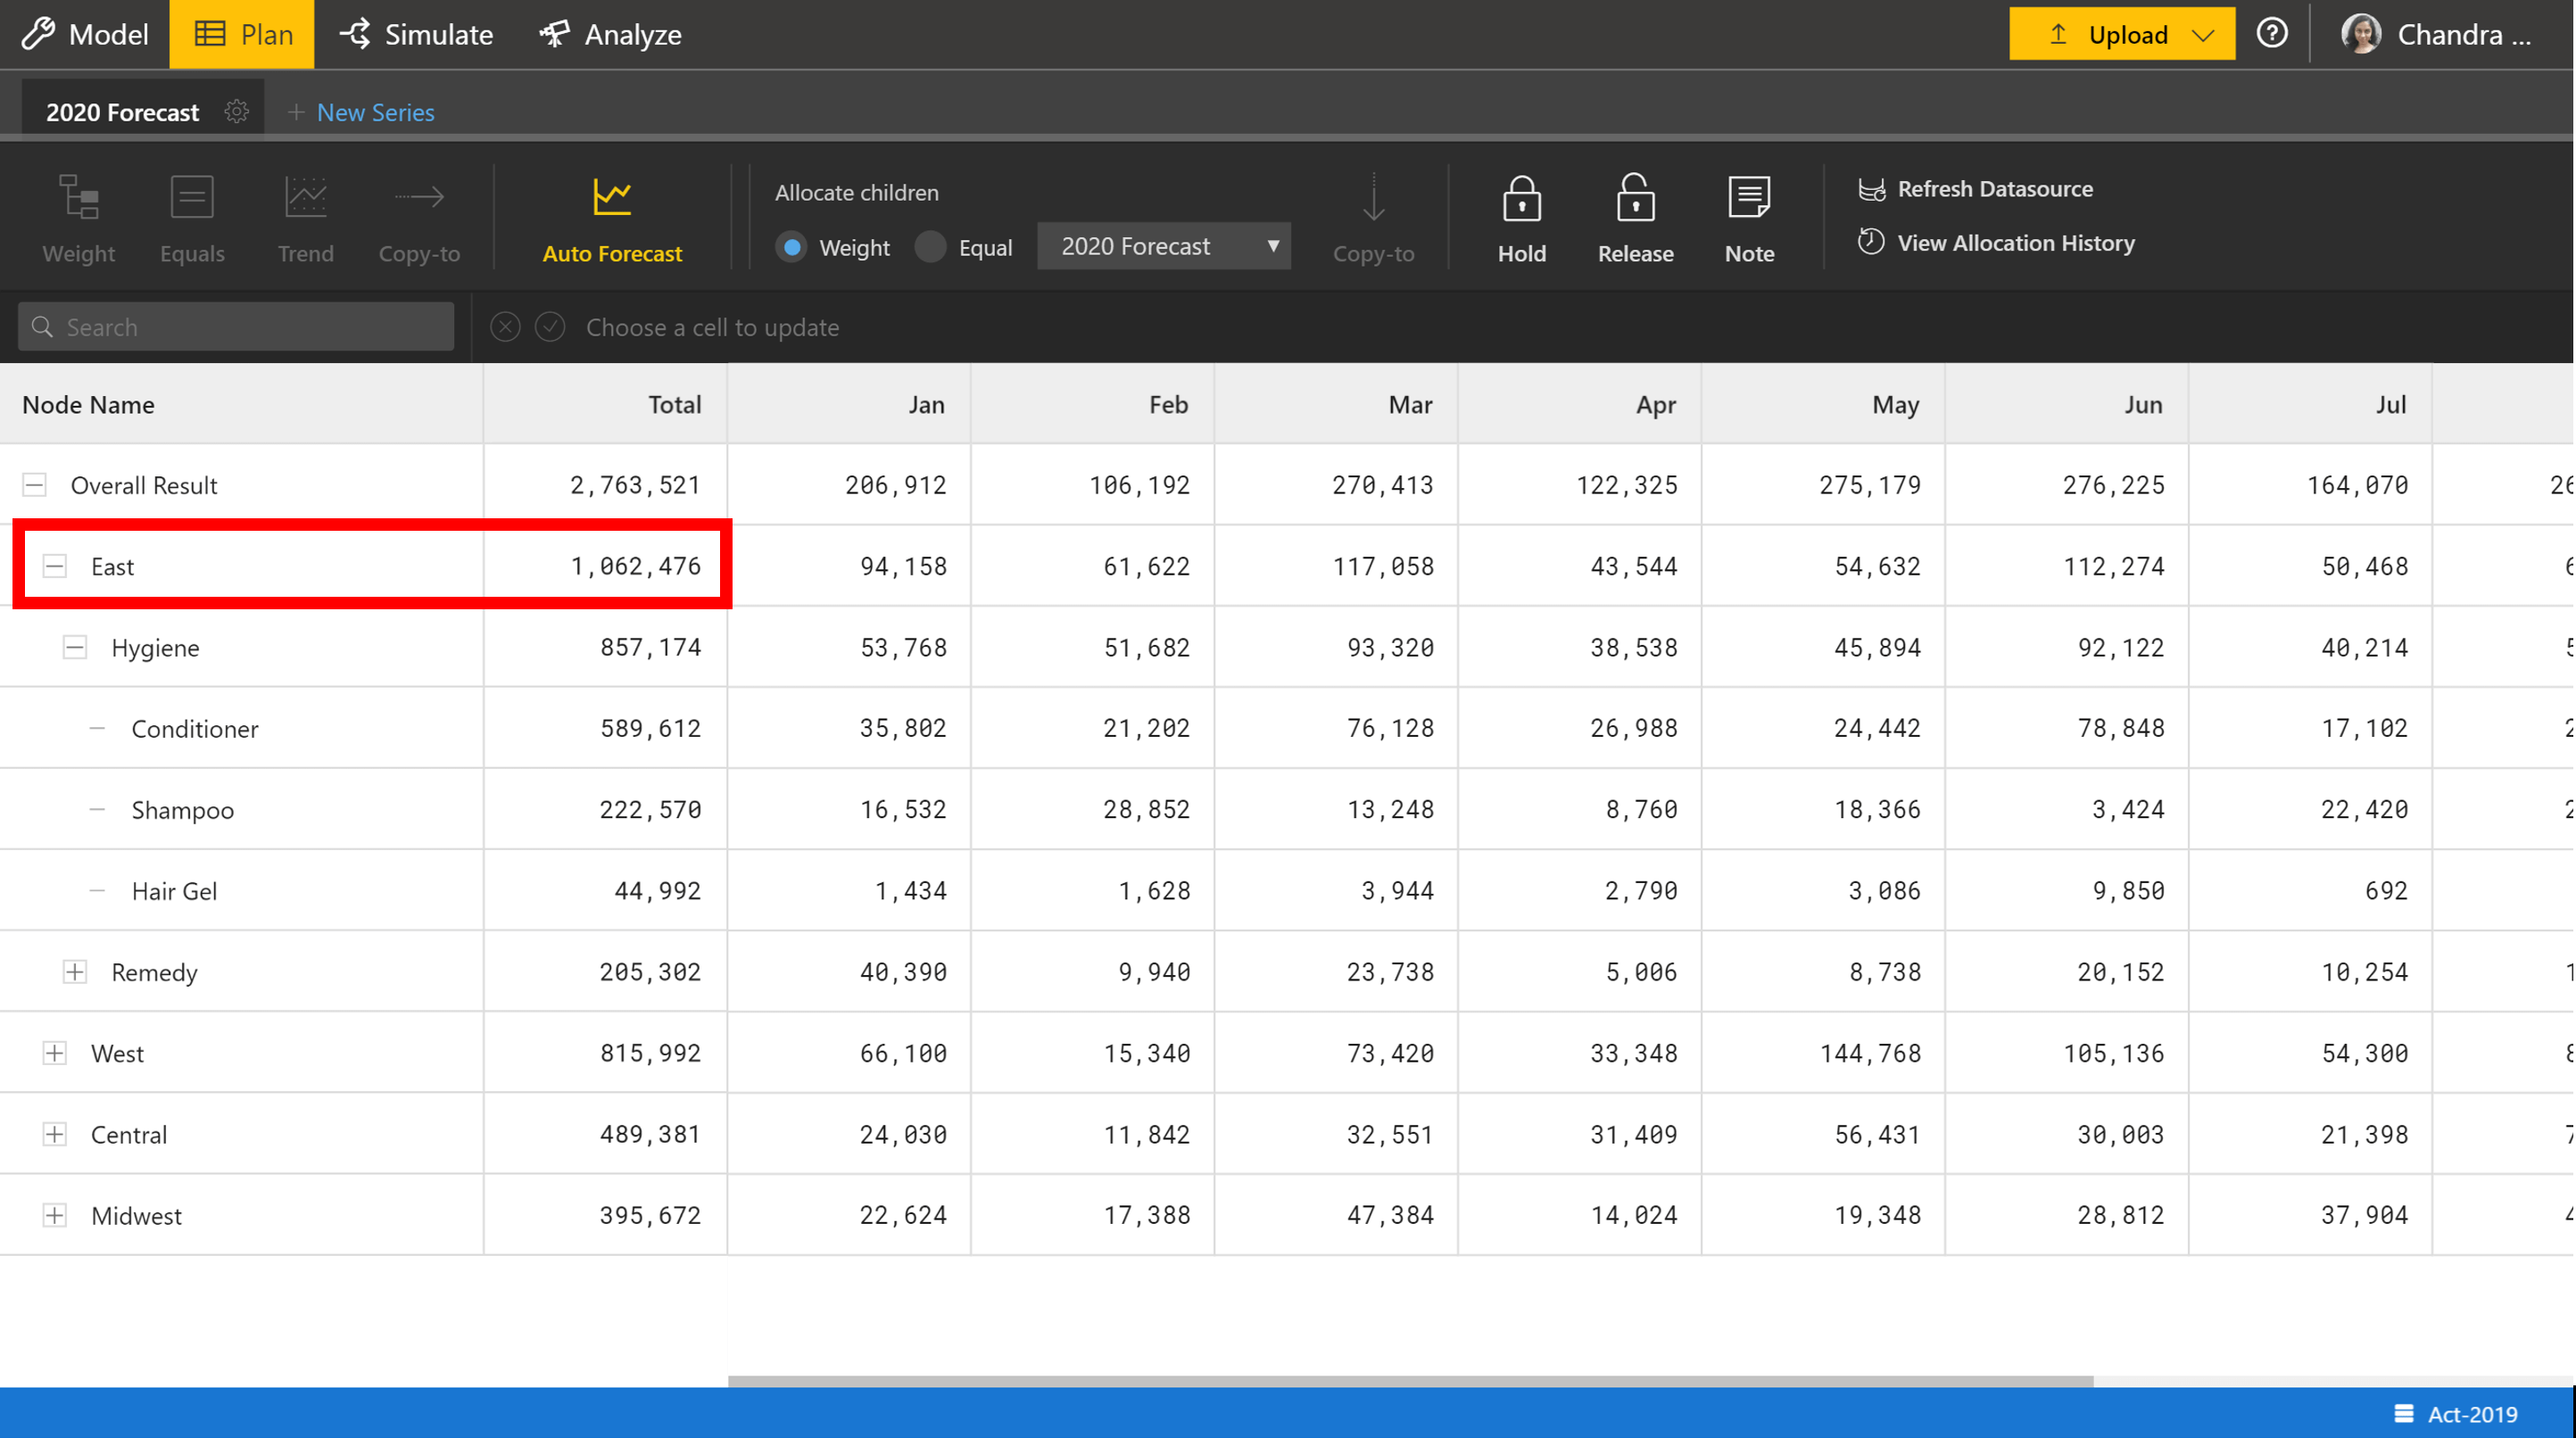
2. Select the level at which you would like to forecast. Here we can choose the ‘East’ region.
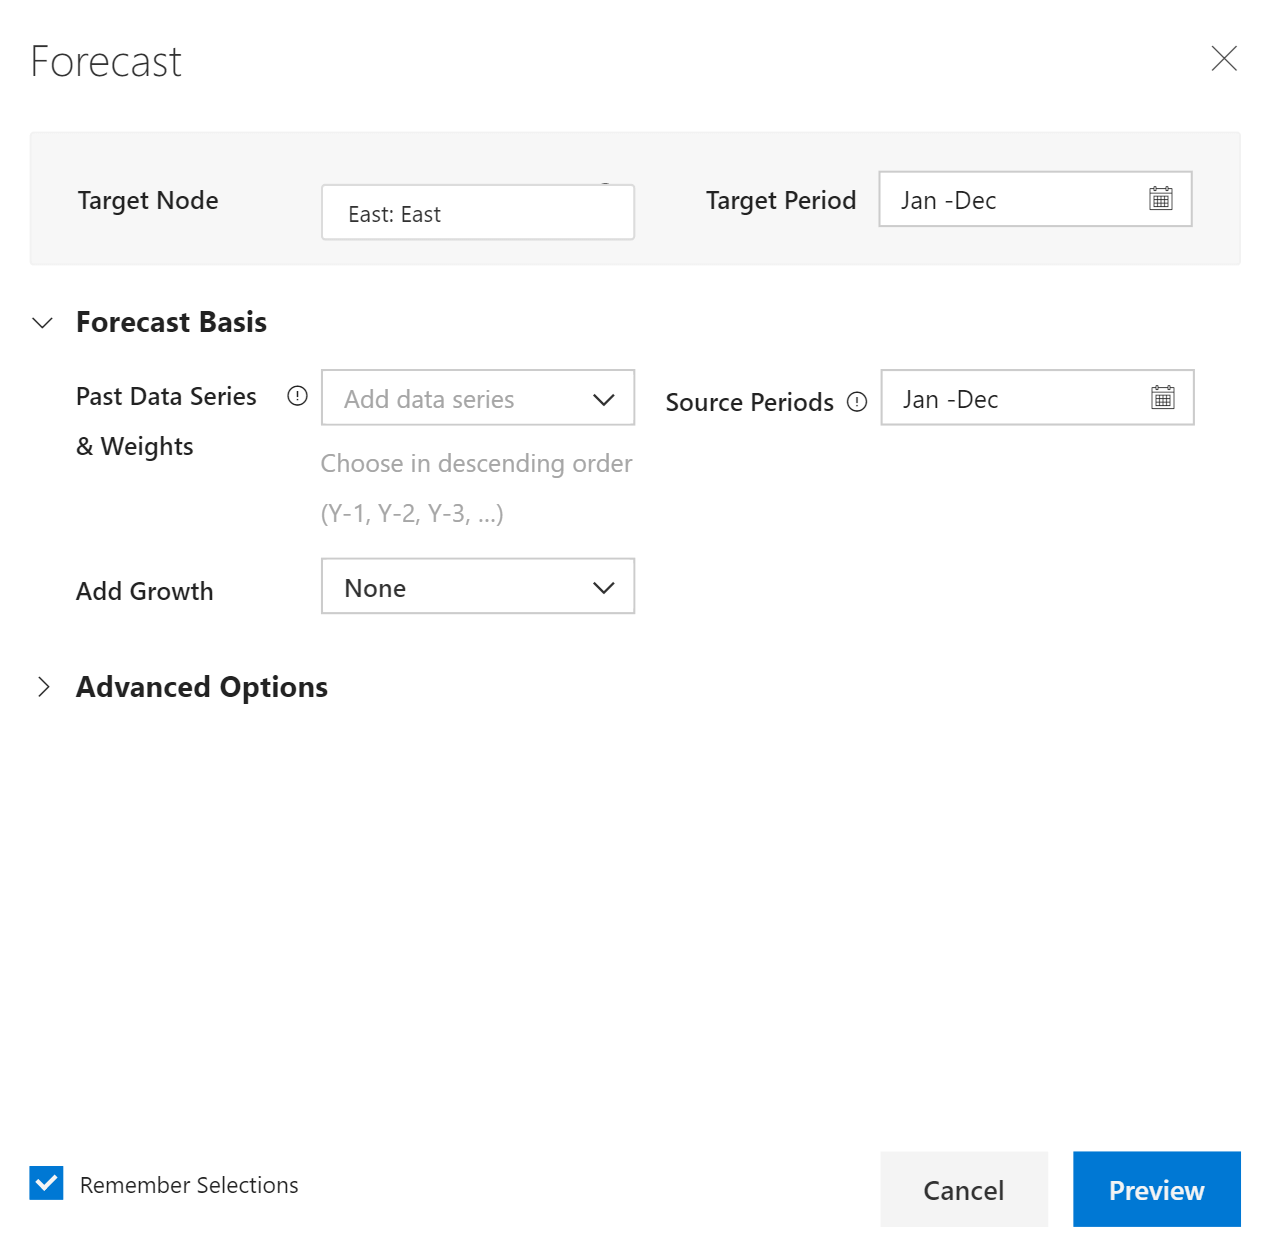
3. Click on Auto-forecast. You will see a pop-up.
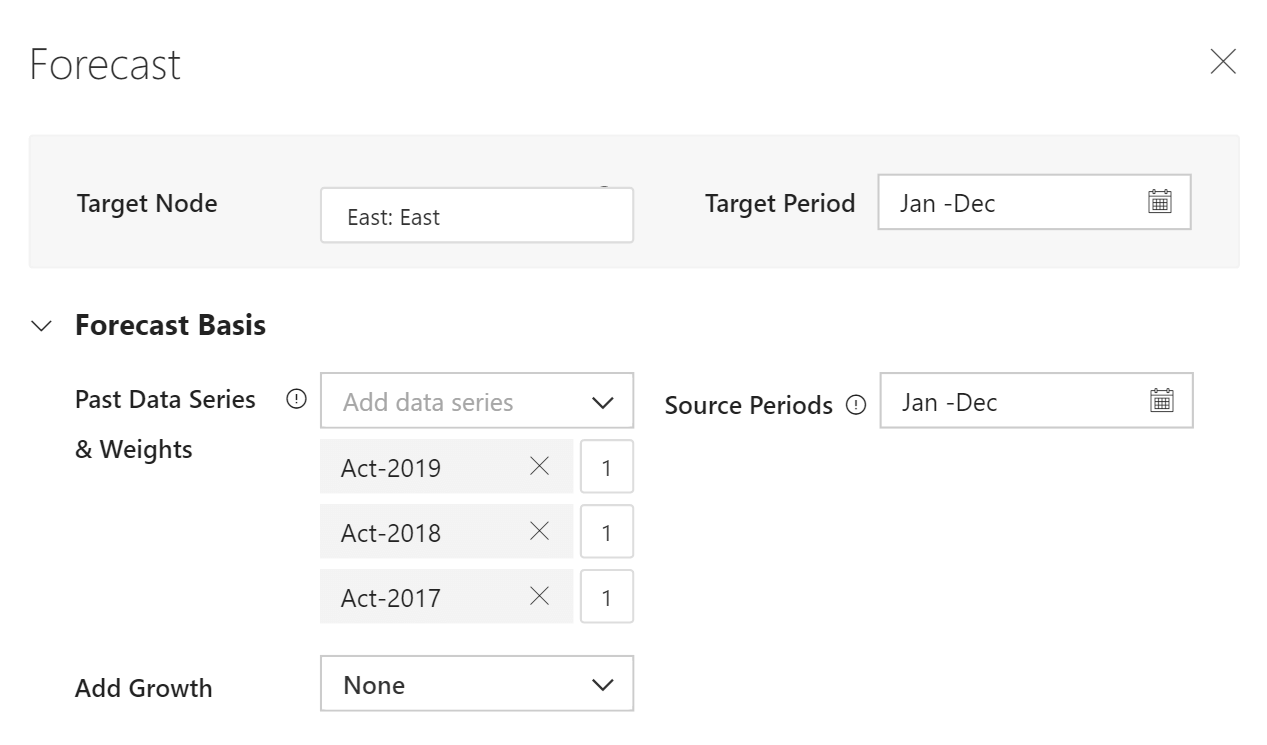
4. Input the source years under ‘Forecast Basis’ using the dropdown. You can give the weights for Act-2019, Act-2018 and Act-2017 – but for our example, we are giving equal weightage (hence the numbers 1,1,1).
We do not have to change source & target periods as we are forecasting for Jan to Dec 2020.
5. Click on Advanced Options
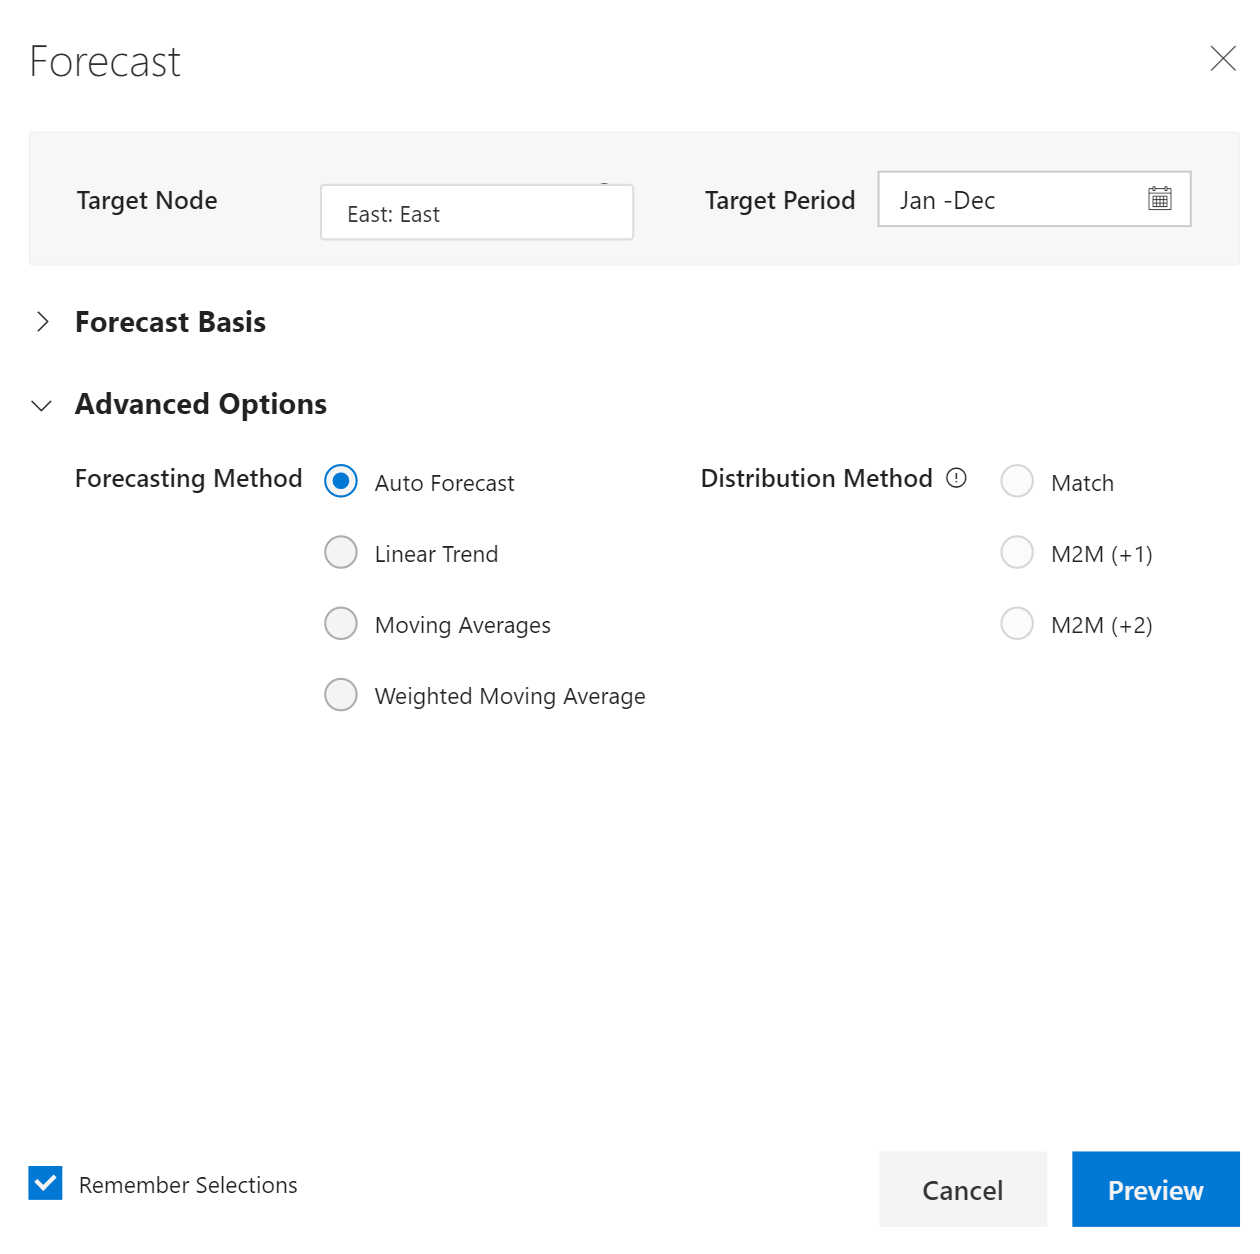
6. Several options are available here.
- The linear trend method forecasts based on past data without considering cyclical or seasonal factors.
- The moving average & weighted moving average methods smoothen out any irregularities in past observations, with the latter option enabling weights for specific periods.
- The auto-forecast option supports those with limited knowledge of various forecasting methods. This method delivers a combination of optimized, balanced and conservative forecasts (shown in step #9), from which the user can choose one that they are most comfortable with.
E.g. The Weighted Moving Average is shown here.

But we will use Auto Forecast and select ‘Preview’.
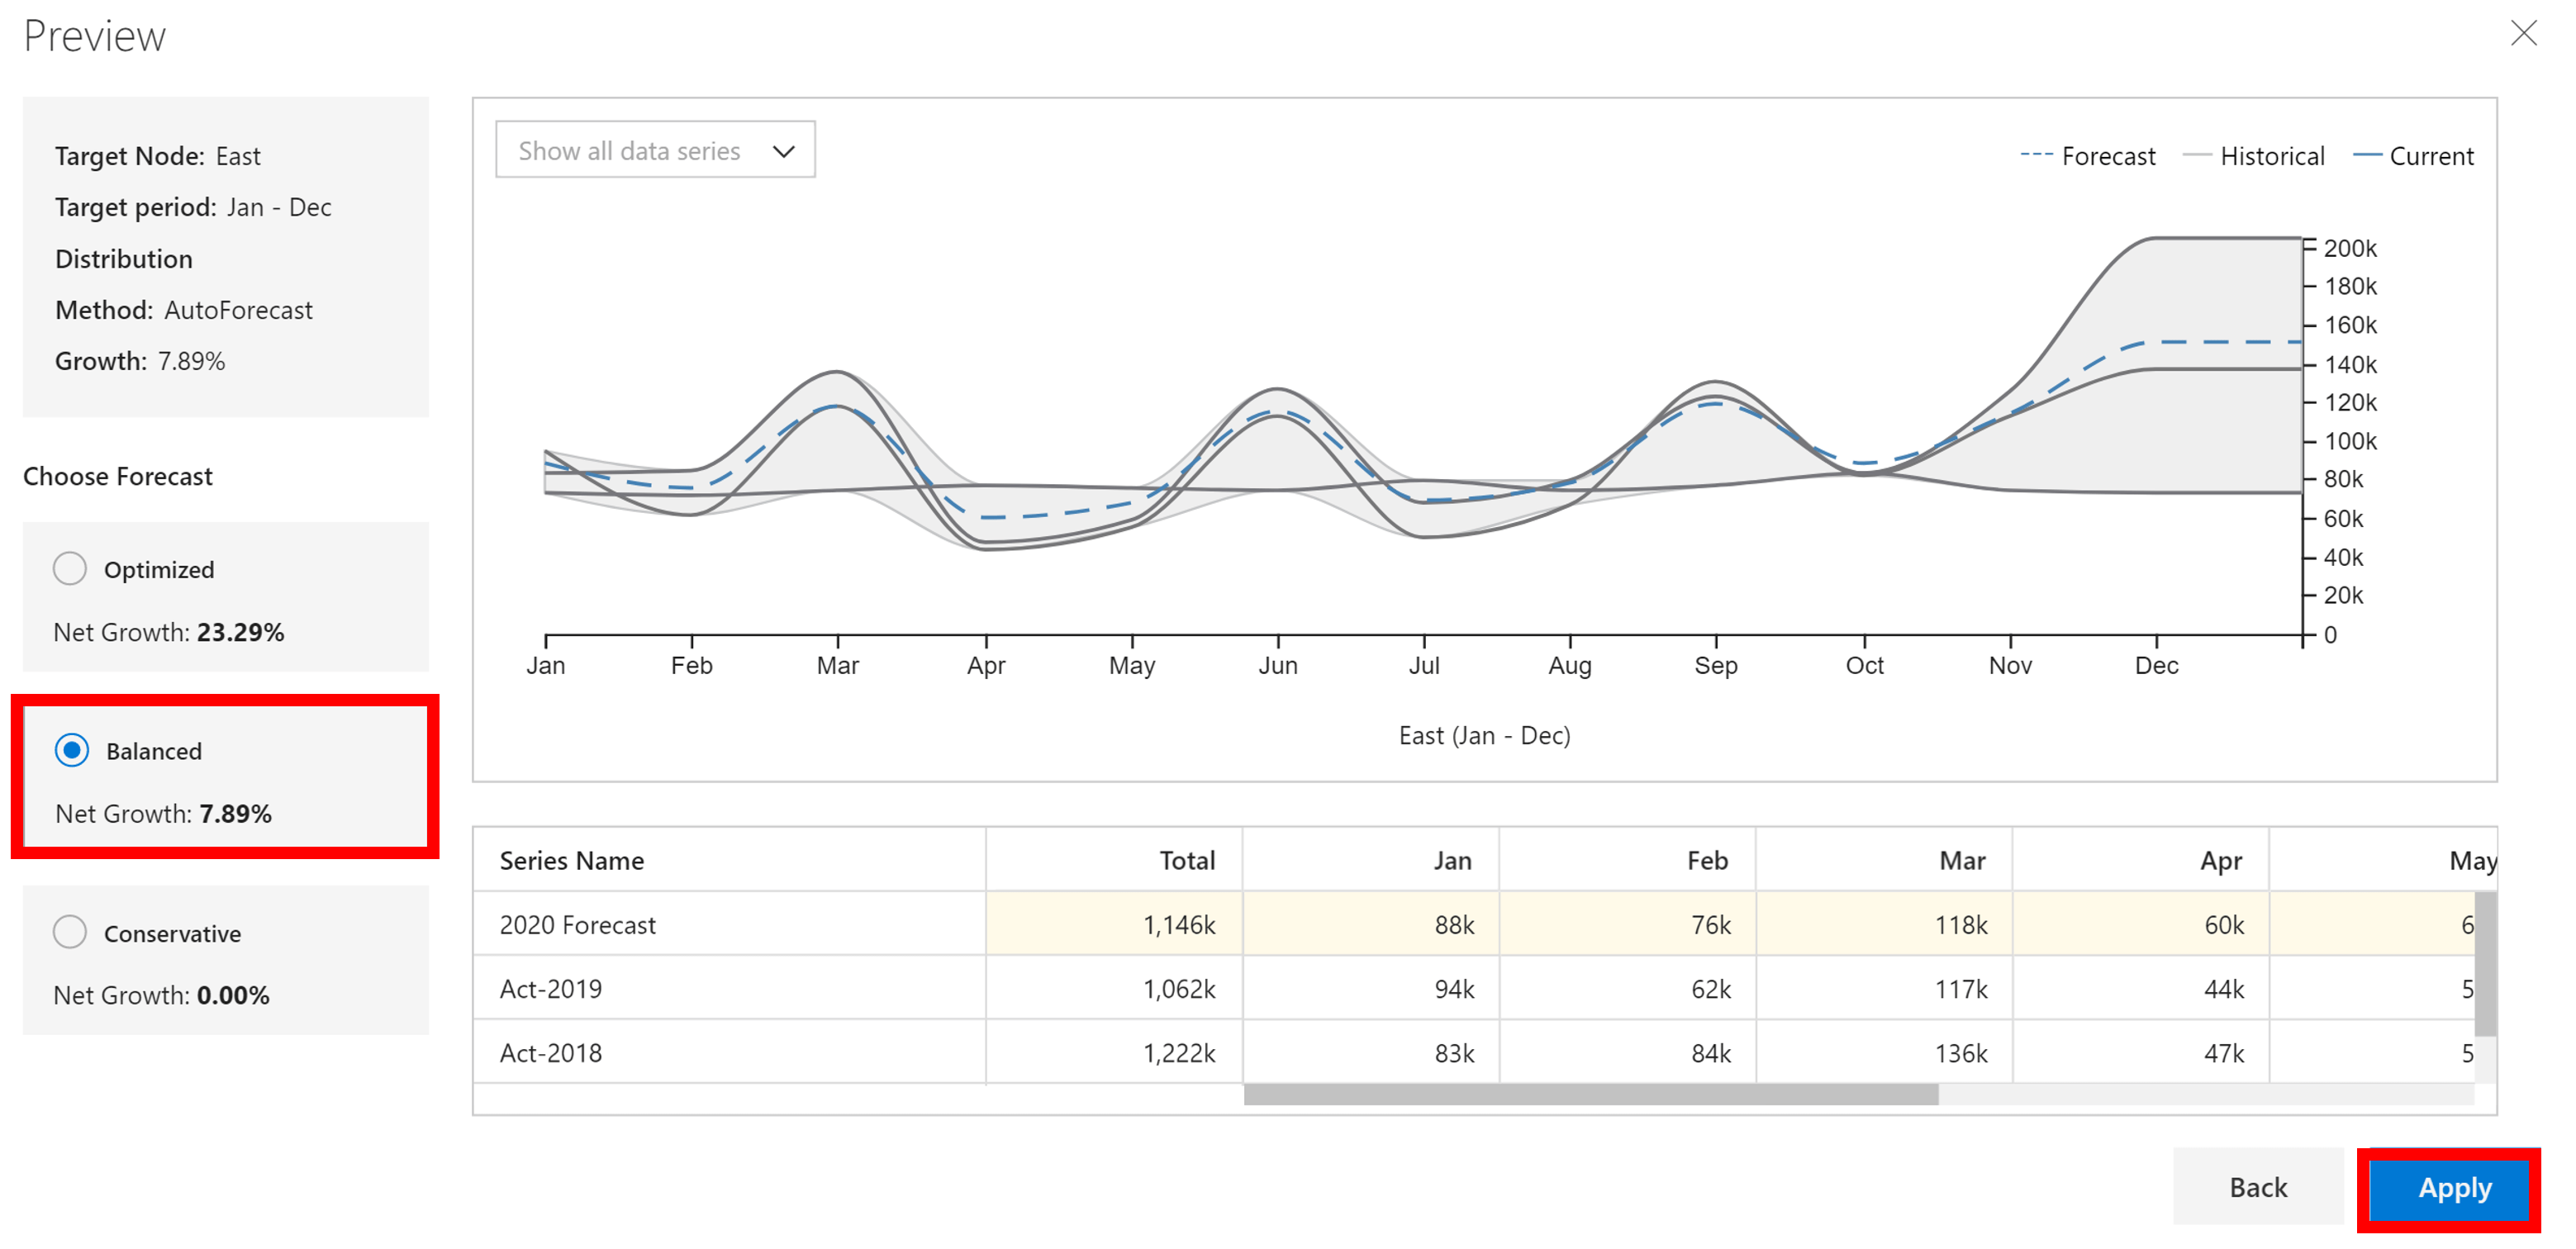
7. You would be able to see a preview with three options.

8. Choose the option that you like and click ‘Apply’.
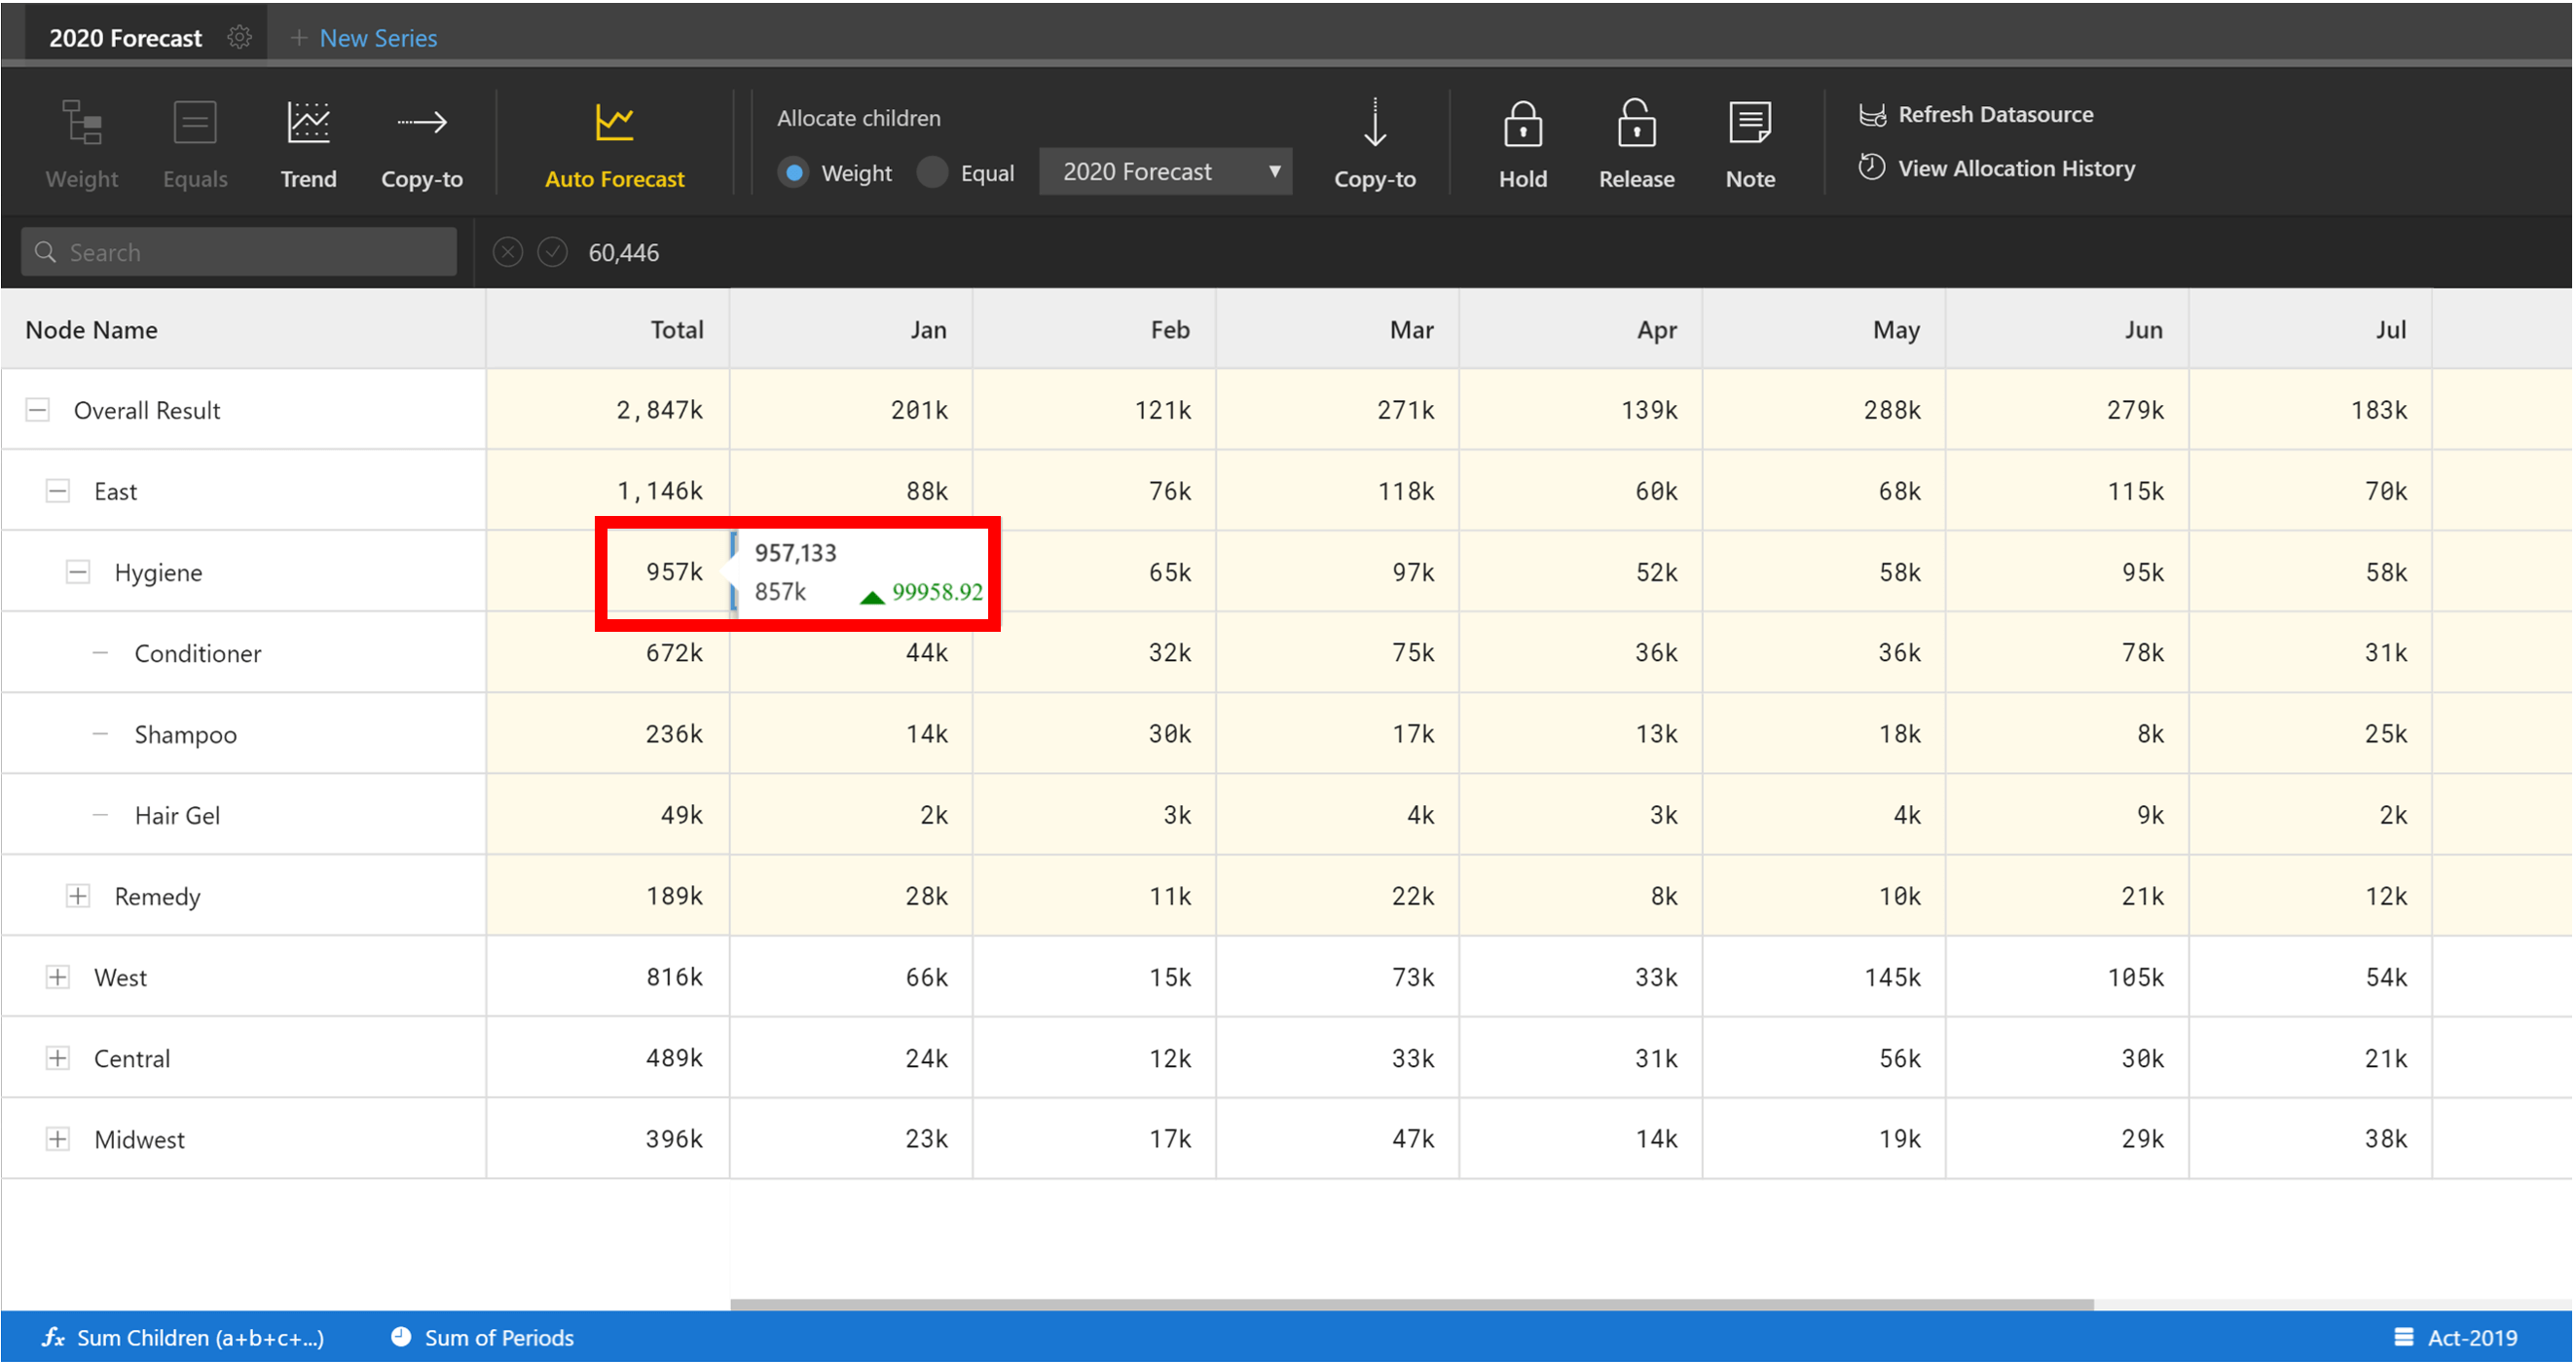
9. You would now see the Plan tab updated with the forecasted values.

10. When you mouse-over, you would also get to see the variance with the most recent year (since we started with 2019 data).
As part of ValQ Roadmap, we are planning to bring additional time-series forecasting methods inside Microsoft Power BI such as the following,
- ARIMA
- Exponential Smoothening (Single)
- Exponential Smoothening (Double) / Holts Method
- Exponential Smoothening (Triple) / Holts Winters Method
Is there any other time-forecasting method that you would like to see as part of ValQ? Let us know.
* * *
About ValQ
ValQ helps businesses visualize, simulate, plan & analyze their data like never before. It is a multi-purpose application available as a visual for Microsoft Power BI.
It can support various use cases such as business modeling, planning, budgeting, time-series forecasting, value driver planning, sale/finance/operations planning, sensitivity analysis, attribution analysis, variance analysis and more.
Download the latest version here and get started with ValQ today.


