
ValQ for Modern Visual Planning using Microsoft Power BI. It is a serverless, lightweight, multi-purpose application running on Power BI supporting use cases such as planning, forecasting, budgeting, time series forecasting, and value driver planning. ValQ is designed to enable executives, decision-makers and business analysts to seamlessly connect to data to make effective decisions. ValQ is fully customizable, mobile-compatible and has a highly engaging and intuitive interface. It is now available for SAP and Microsoft Power BI.
***
In the previous blog, we took a look at one of the features of ValQ’s May 2019 release, the Quick Editor. Here, let’s explore another new feature in this release – the Table View.
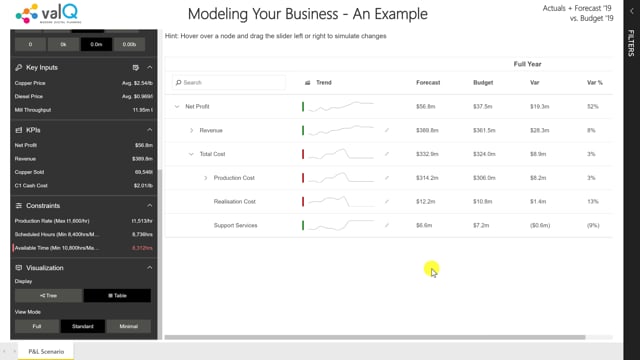
On selecting the Table option in the Visualization section of the Navigation Panel, you can view the entire model in tabular format. A Table view of a sample model is shown below.
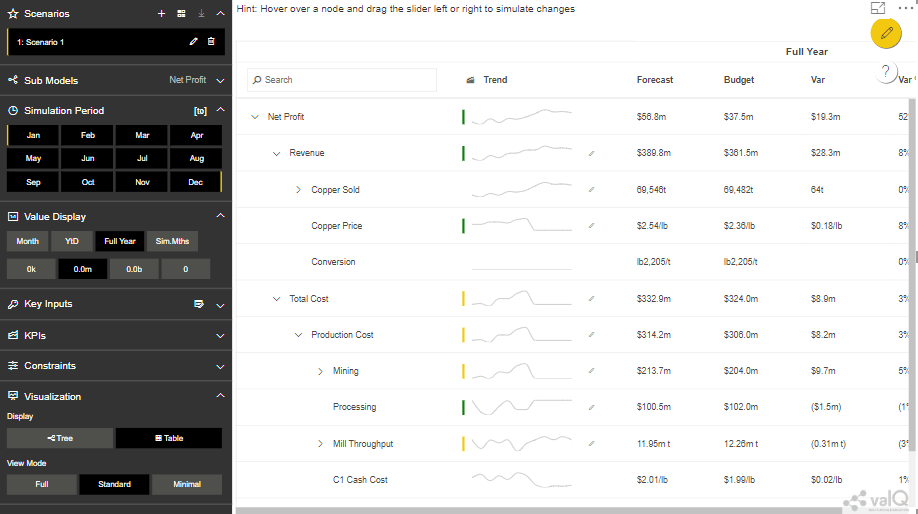
The Table View has been designed in such a way that you can switch between Table & Tree views in a seamless manner. Some of the functionalities the table view includes are the following:
1. Hierarchical (Expand/Collapse) Navigation
Just as with the Tree view, you will be able to expand and collapse KPIs. In addition, the expand/collapse status of the model in the tree view and the table view are kept in sync when you switch between views.
2. Popup screen
Clicking the name of the KPI opens a detailed popup screen in the same way as with the nodes in the tree.
3. Level of Detail
The navigation panel on the left provides three options to view the table – Full, Standard and Minimal. These provide greater control in choosing the level of detail to be displayed.
4. Conditional formatting
The KPIs also have a performance indicator colour band on the left – just as with the tree view.
5. Trend Line
A sparkline graph indicating the recent & projected trend for that KPI is displayed.
6. Simulation
For simulating a KPI, hover over the sparkline and move the slider to the right or the left. These changes are immediately captured in the model and are also tracked on the top left of the table – as with the Tree view.
7. Search
The search option enables users to search for any KPI and jump to that metric instantly.
To learn more, tune into one of our ValQ Webinars or try our product for free here.


