
We’re back again with our updates and upgrades in the latest version of ValQ 2.0.8! The main focus of this release is on improving the overall user experience. We’ve listed down the set of feature enhancements most anticipated by our valuable customers.
A quick overview of the updates:
New Slide Right to Option for Node configuration:
This option introduced in Node configuration offers you the choice to increase/decrease the node value when you move the simulation slider to your right.
For eg., Set the ‘Total Cost’ node to ‘Decrease’ for Slide Right to option in the node configuration. You will find that the value decreases when you slide right on the node. This provides you with the flexibility to customize the simulation slider to always show the favourable/unfavourable outcome in the same direction while you perform the simulation.
Access Edit Node settings from a node:
You can now access the ‘Edit node’ option at the node level itself by clicking on the pencil icon. This serves as a shortcut for the Edit Node configuration window, especially in a large ValQ model. This enhancement is available in both the tree & the table view.
Quick tip for planning in Power BI’s reading view:
A quick tip has been added on the Plan tab while on Power BI Service’s reading view. This gives a heads up for the users to switch to Edit mode if they want to access the options available on Plan Tab.
Fixed Reset All bug in Plan tab’s History Log:
Reset All option while performing allocations for Rolling Forecast did not work and the values disappeared on switching ValQ tabs. This bug has been fixed and you can now use Reset All to remove the changes performed from History Log.
Table view periods update with Navigation Panel:
Table view periods now get updated based on the Simulation period and Value Display selection made in Navigation Panel. For example. In the navigation panel, select Jan to March as ‘Simulation Period’ & Sim.Mths as ‘Value Display’. If you check the table now, you’ll find that the information displayed is consistent with the selection in the Navigational Panel.
Back to the main model option in the Tree view:
The newly added ‘Back to main model’ option helps to easily navigate and switch back to the main model in Tree view without having to access the Navigation Panel.
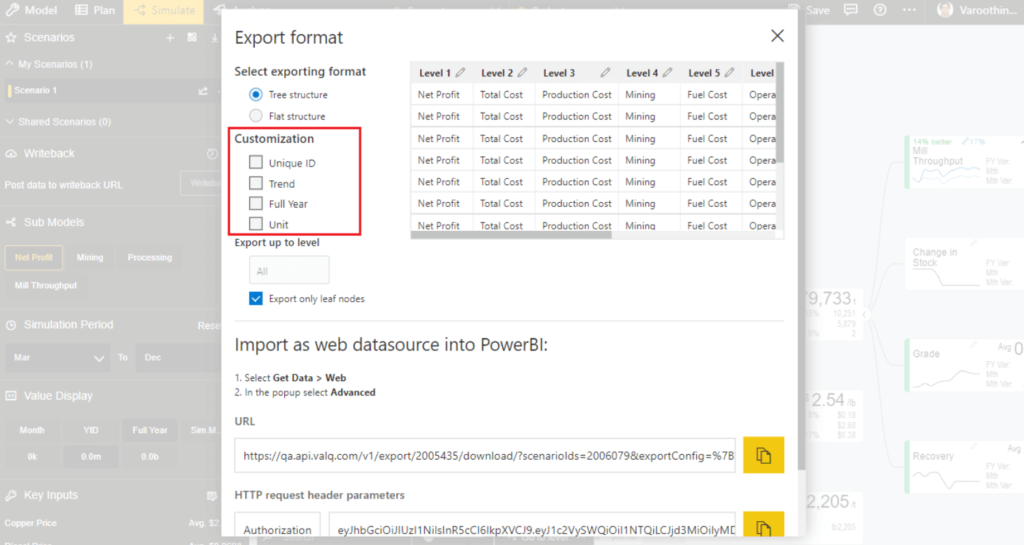
Customization enhancements for Export as Data Source:
- ‘Unique ID’ field is added to Tree structure under Customization section of the Export as datasource feature.
- The ‘Customization options’ previously fully checked are now unchecked by default. Only when the user requires the option, they can enable it manually.
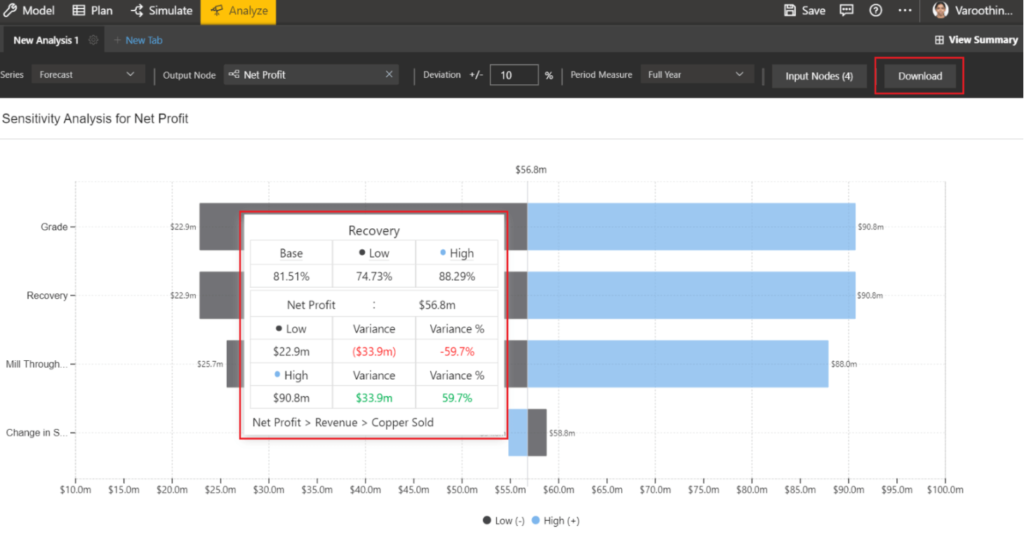
Updated Sensitivity Analysis chart:
- You can now easily download the Sensitivity Analysis report & export it to Excel with the ‘Download’ button on the chart.
- The tooltip on the Sensitivity Analysis chart has been updated to include details such as Variance % and Input node’s values for a bird’s eye view of all details at one go.
New & improved UI for node search across all tabs:
‘Node Search’ has been updated with a more convenient UI for enhanced readability and ease of use across all the tabs in ValQ. Users can search for a node anywhere by its title as well as Unique ID based on their needs.
For example – Click the ‘Edit Node’ option next to the node and select ‘Composite Node’. Here, when you search for a node, they are displayed by their Title followed by Unique ID.
In the Sensitivity Analysis tooltip, along with the node search, you will also get an overview of the lineage of the nodes, thus showing a glimpse of the model for you to recognize the node. This is especially useful when nodes have the same Title at a particular level, and they are distinguished by their parents.
And this is just a glimpse, we have so much more awaiting this release!
Download the latest version here and get started with ValQ Collaborate Edition today.


