
ValQ December 2019 Feature Summary
ValQ, Modern Visual Planning for Microsoft Power BI has been evolving at an incredible pace since its first release in May 2019, thanks to the ValQ community.
ValQ 1.4 delivers a host of features including Planning Tab, Variance Analysis, Collaboration, and more. The workflow has been revamped to make it more user-friendly, and there are a lot more options for customizations.
Read on to learn more about the latest features and developments in this release.
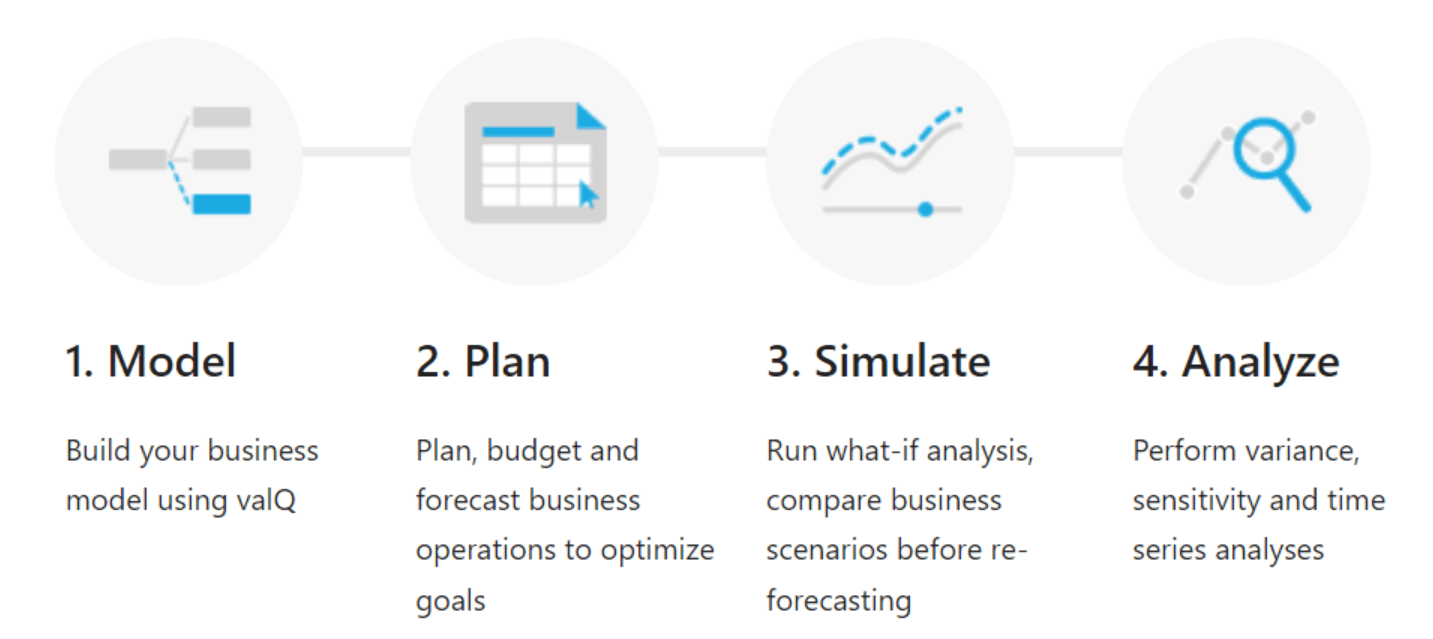
Revamped Workflow
With 1.4, you have different panels that enable streamlining of the planning process. The four panels are shown in the image below.
Planning Tab
With the planning tab, you can do the following:
- Create new plans based on existing data(e.g. prior period actuals or existing budget) or from scratch.
- Create budgeting and allocation scenarios using options such as ‘Weight’ and ‘Equal’ or other options such as ‘Trend’, ‘Copy’ etc.
- Modifications to the series can be done either by specifying percentages or values.
- There are also options to ‘Comment’, ‘View History’, ‘Restore Steps’, ‘Refresh Datasource’ and ‘Filter’ nodes.
Variance Analysis
Variance analysis displays the variance between the primary and comparison series across all nodes in the model. The series that were created or edited in the Planning tab is also available here.
- You can customize the periods across which the two series are compared.
- You can also view the variance in absolute or percentage values or filter nodes by variance.
- You can download the results of the analysis as an excel file.
Collaborative Features
With 1.4, there is seamless integration to store Model, Plan, Simulation and Scenario data. You can perform the following functions.
- Sync the data to update the server with latest data in ValQ
- Export the CSV file as required from the latest sync data
- Collaborate with other users through commentary
- Track and audit changes to the model
Formulas and Functions
ValQ supports many traditional user-friendly functions that allow you to create complex models. You may recognize many of these from your experience with Microsoft Excel. Listed below are a few examples,
- Logical functions such as IF, SWITCH, AND, OR
- Math functions such as POW, SQRT, EXP, LOG
- Finance functions such as IRR, NPV, PMT, RATE
An ability to refer to individual or combination of period values of nodes has also been introduced with the Range functions such as RANGE, FOREACH, GET and LastNPeriods.
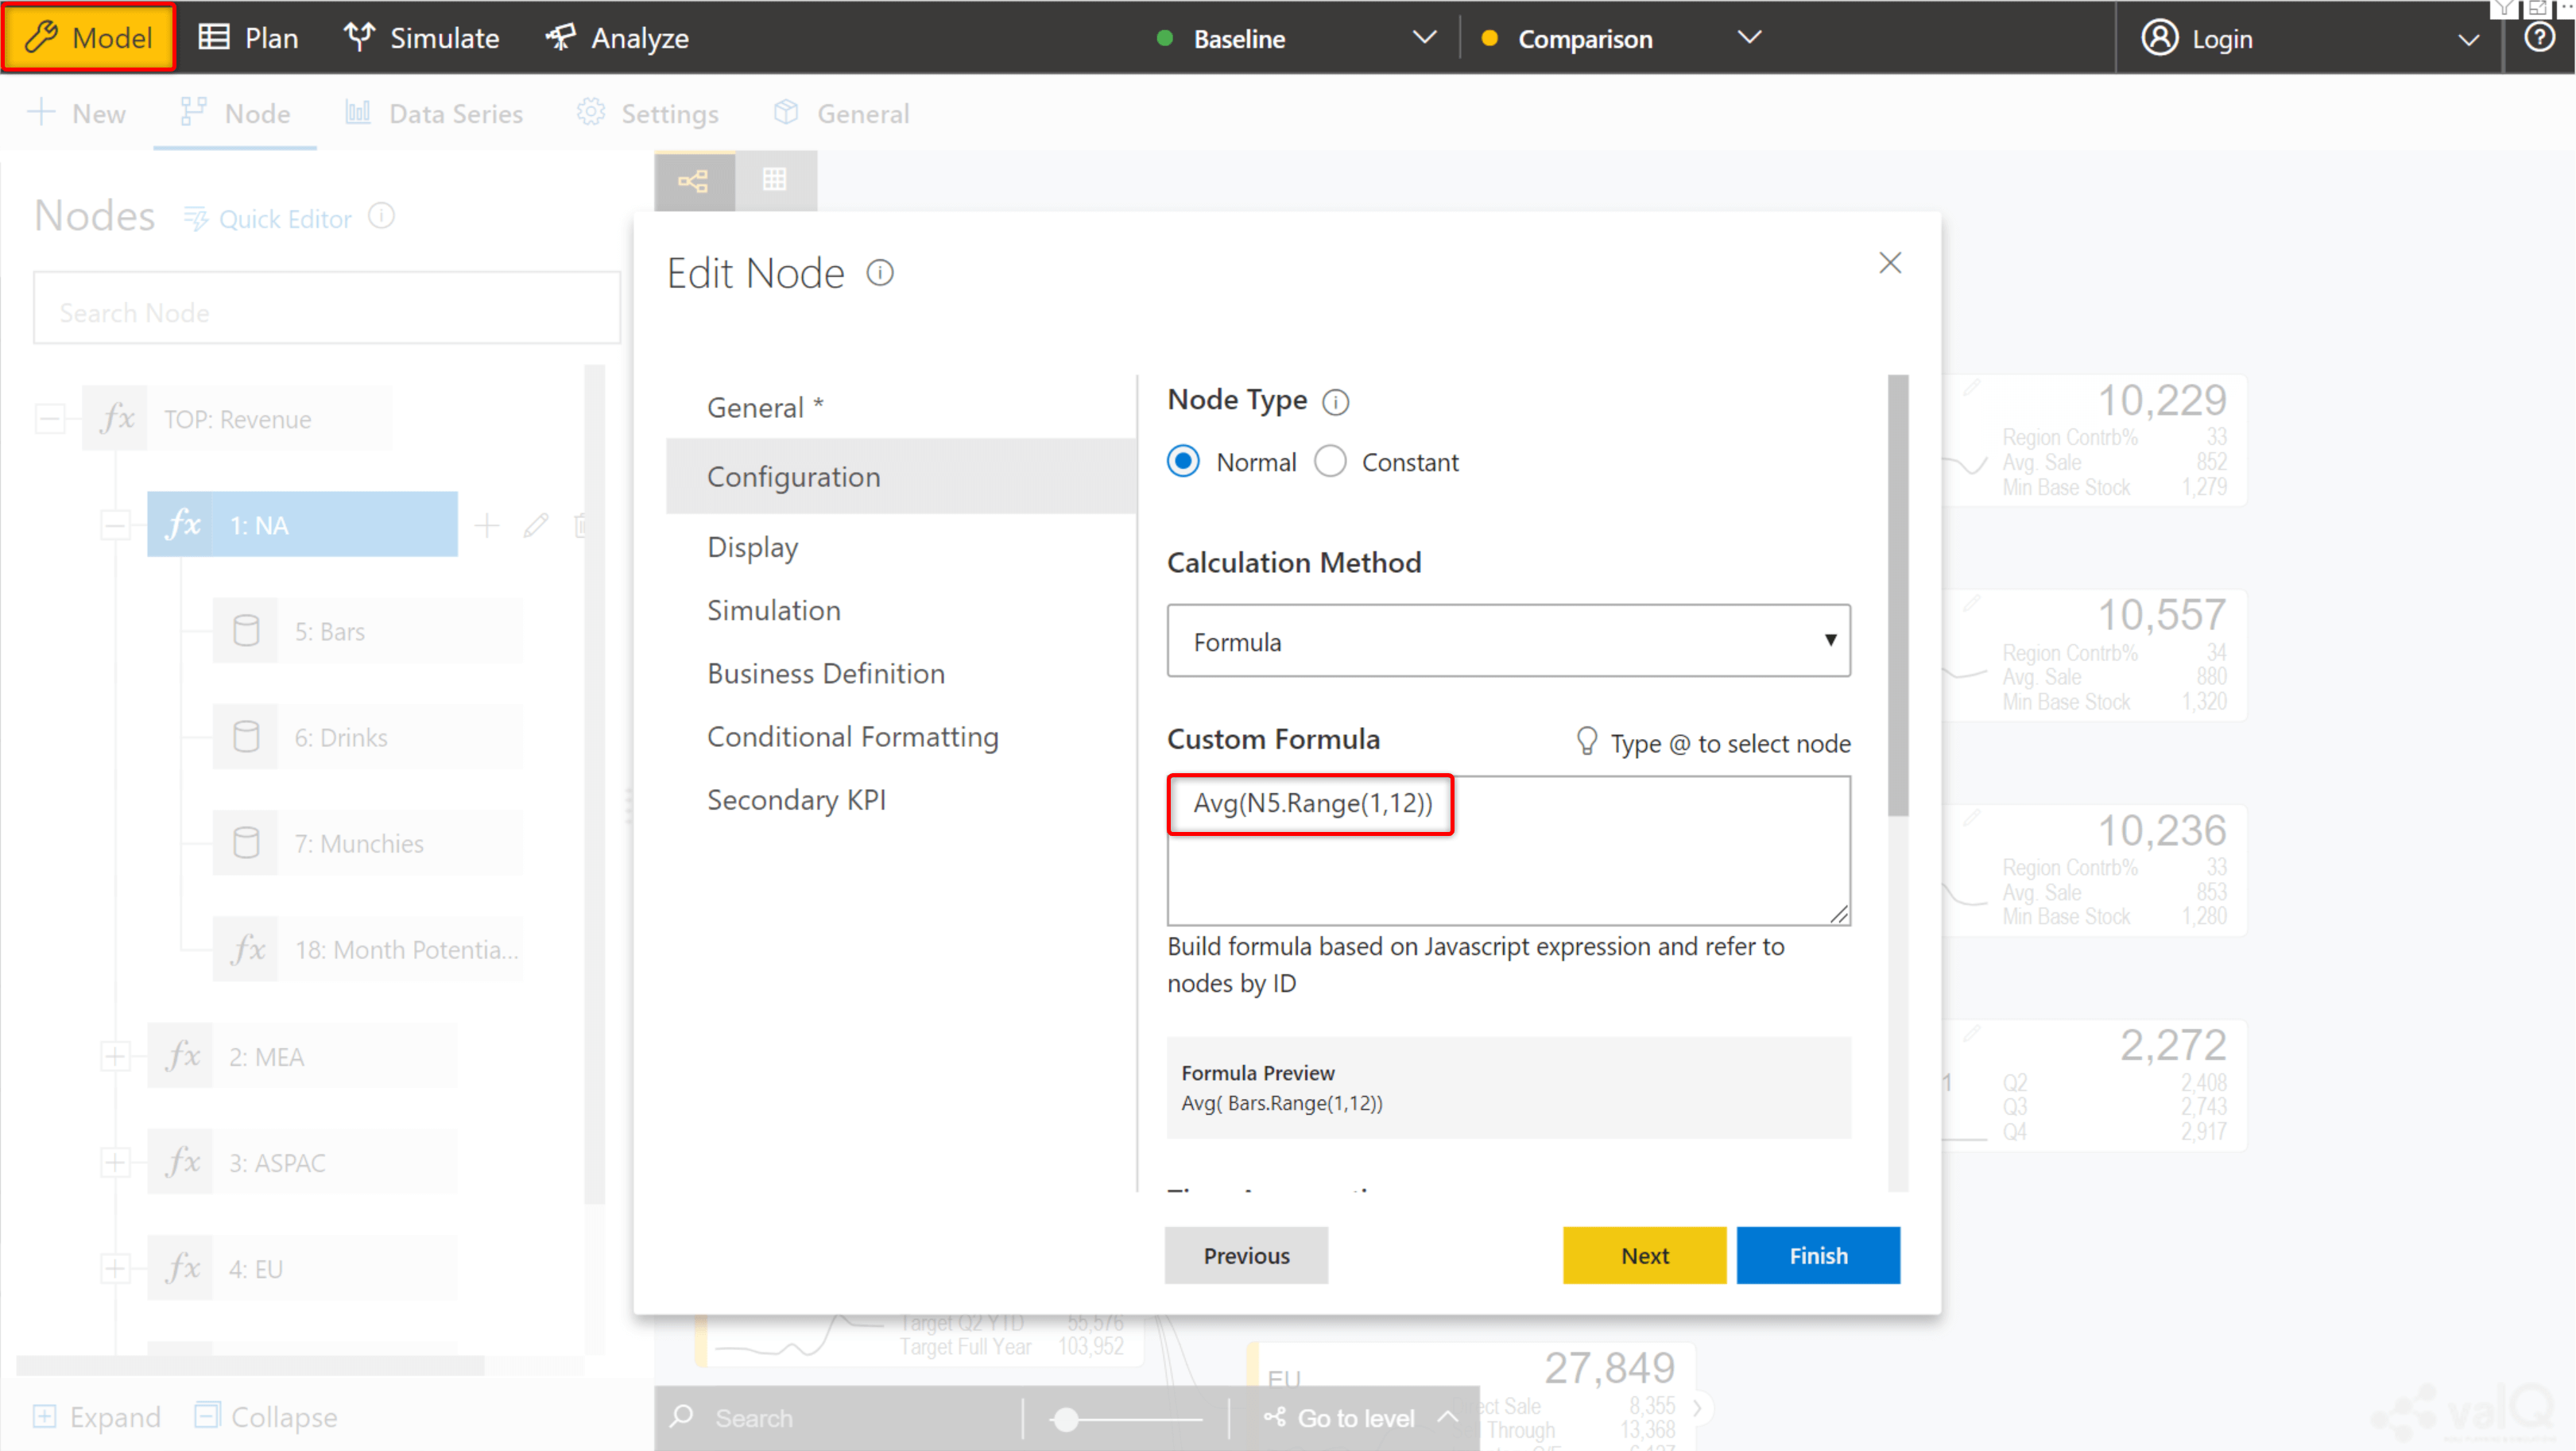
Secondary KPIs
By default, in the node display, you can view the value for the primary period and variance for the primary and secondary period. This can now be customized to display a maximum of 3 additional KPI values with the Secondary KPIs feature.
This can be configured in two different ways.
- Formula – You can calculate the secondary KPIs using formulas in the desired node
- Template – You can use another node in the model as a template to configure the secondary KPIs.
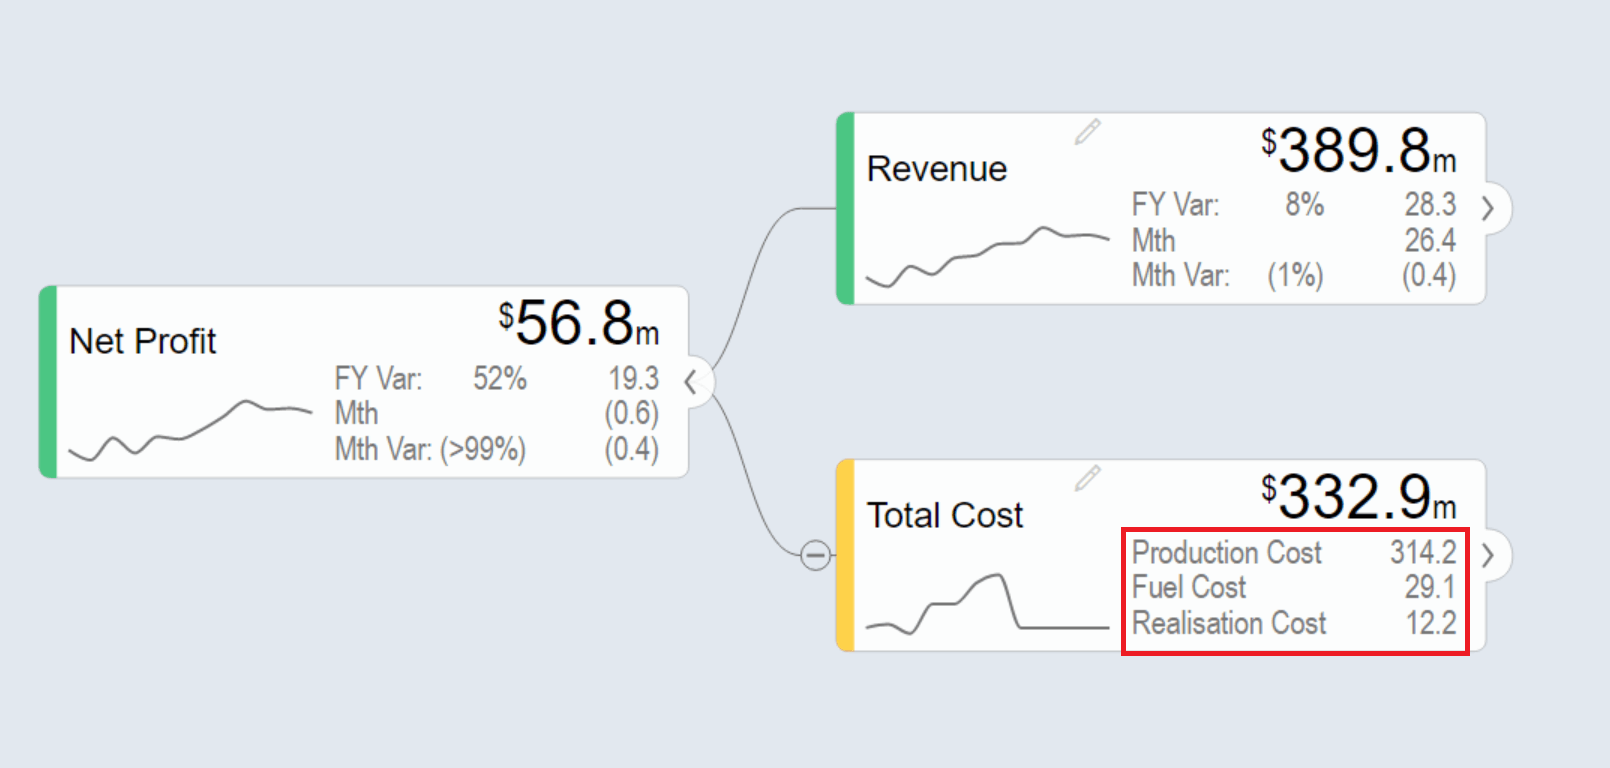
Composite nodes
There may be cases where you need to view a set of nodes at the same place. For e.g. if there are two product categories, you can view the Gross Profit of each of them inside the Overall Gross Profit node.

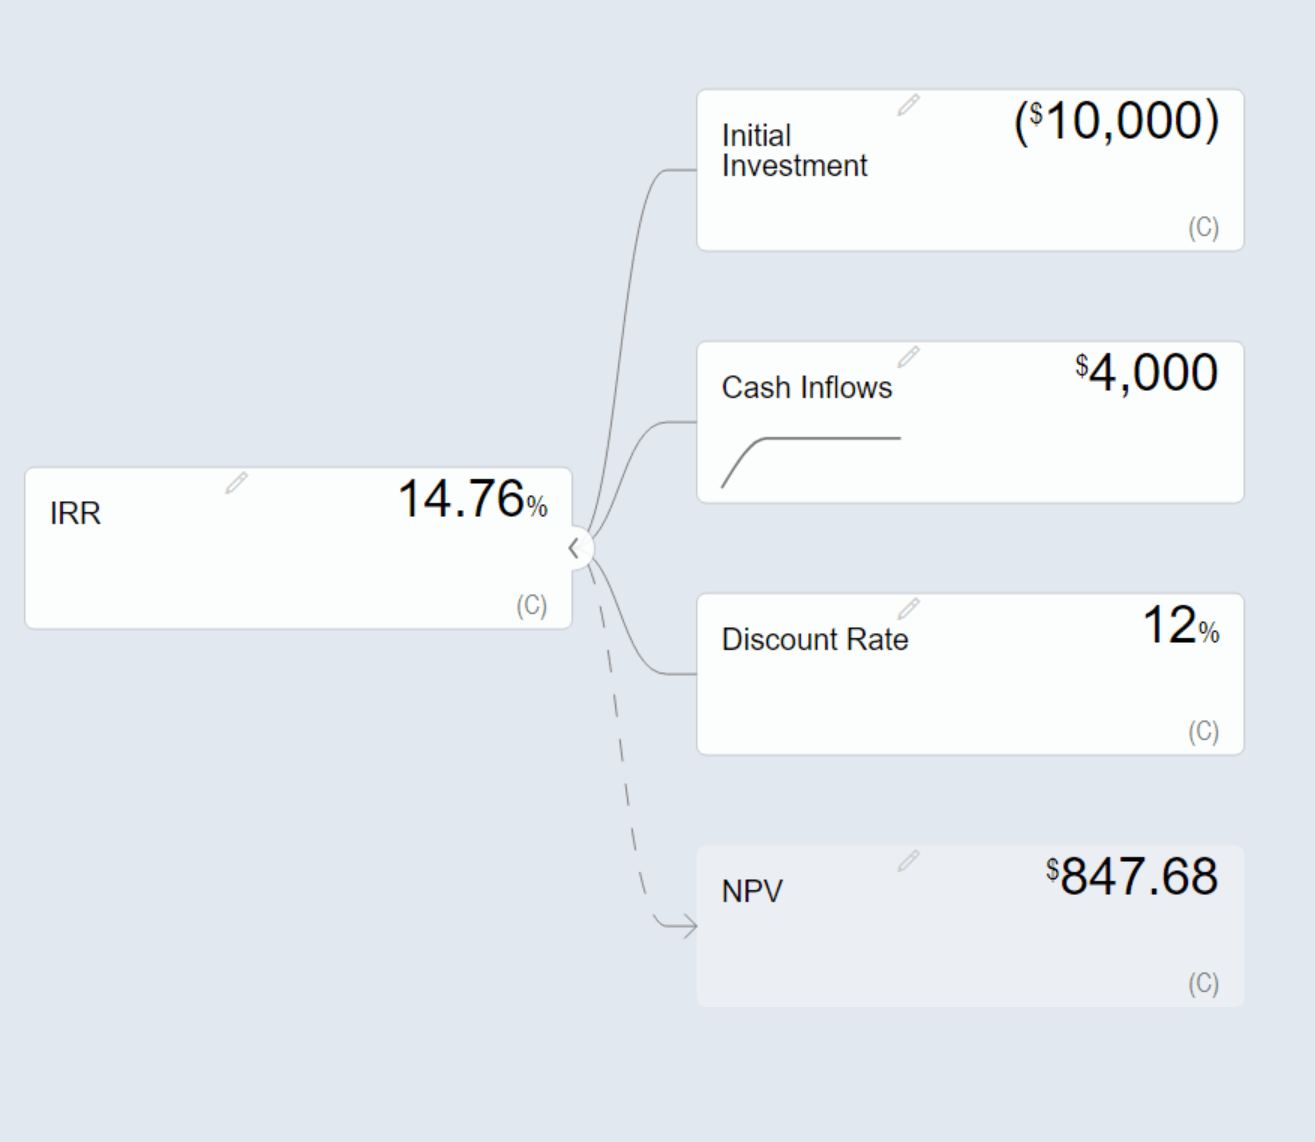
Constant nodes
When building models, you might have KPIs that have values independent of the time period. In such cases, you can choose to define the node as a ‘Constant’ node.
Get the latest version of ValQ here.


