
The latest ValQ release delivers optimized support for up to 10,000 KPIs, enhancements in Variance Analysis, Admin Console, and more. This follows the introduction of an affordable per-user pricing model in ValQ 1.5.
Let’s take a look at the updates and enhancements.
Performance Optimization (Support for fetchMore API)
Up to 1.5.2, there was a hard limit of 30k data points. By adding support for fetchMore API, the total fetched data limit has been extended to 100 MB which extends the support for up to 10,000 KPIs. In this release, we have worked to improve our calculation engine and rendering framework to deliver an optimal user experience.
Enhancements
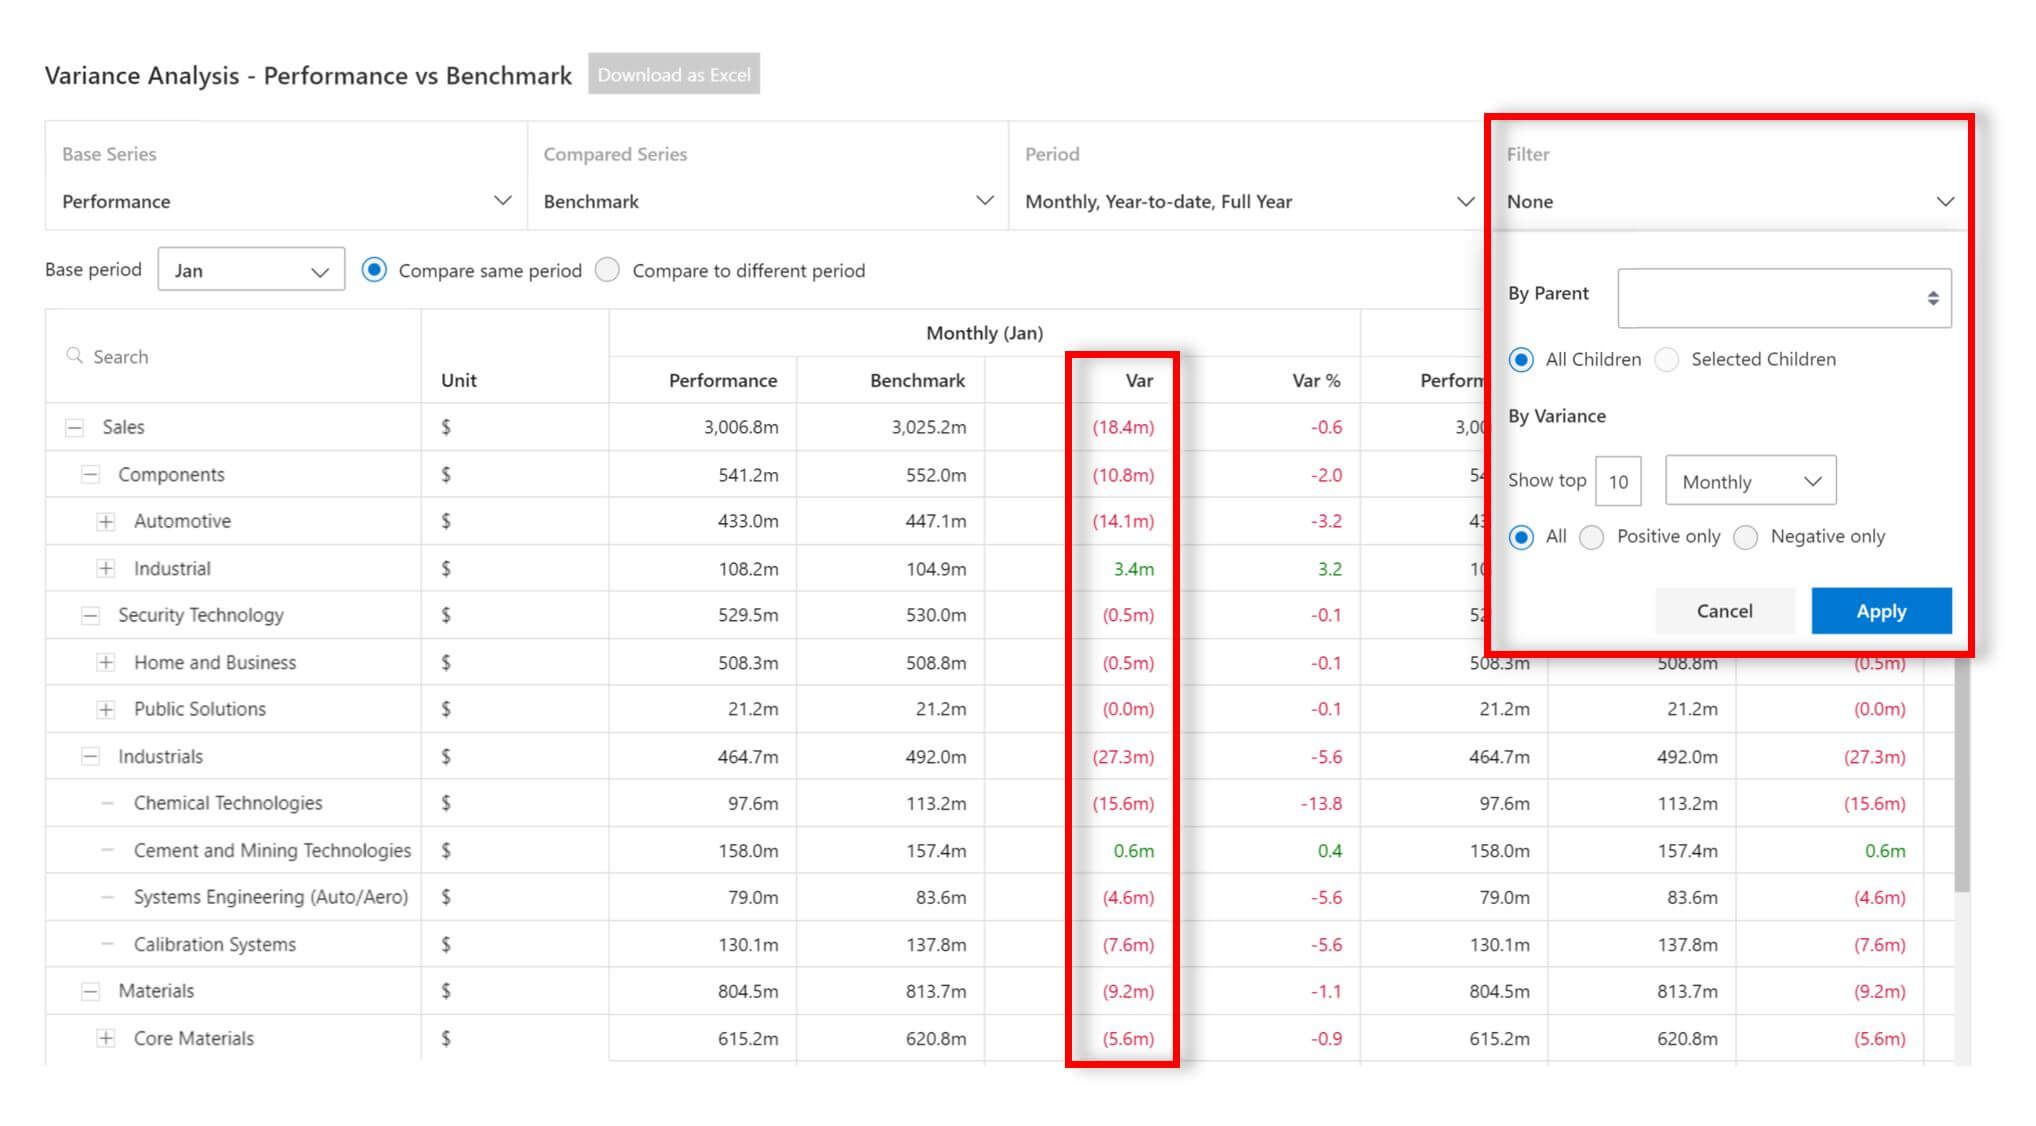
1. Variance Analysis
Conditional formatting has been included for a variance. This is in addition to conditional formatting on variance % which was available in 1.5.2.
The filtering experience has been improved to include the following options:
- Filter by Parent / Selected Children
- Top N Variances
- Show Positive or Negative Variances
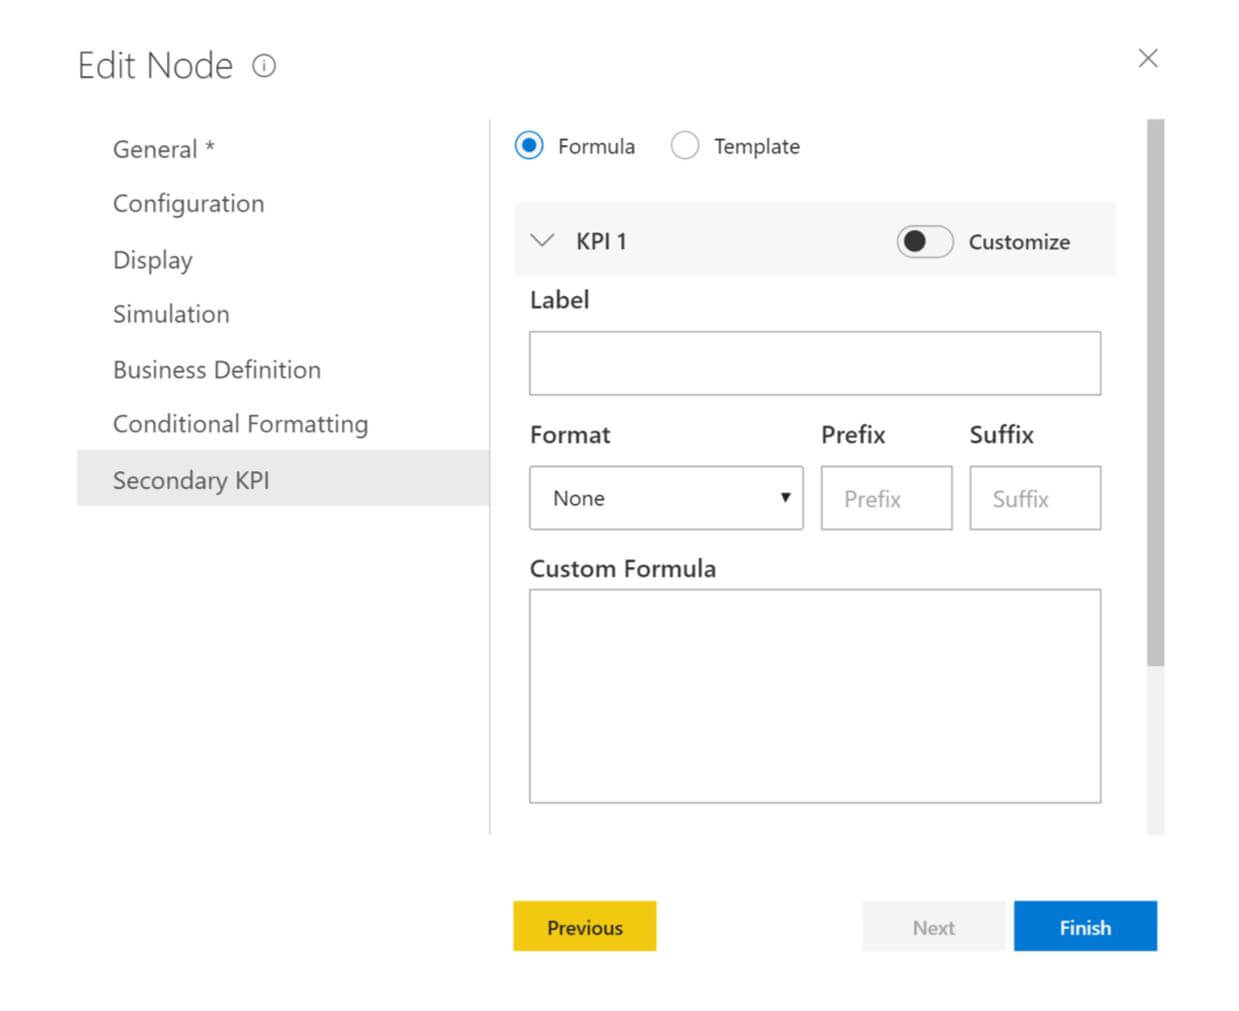
2. Secondary KPI
Till 1.5, the secondary KPIs configured followed the same number formatting as the node. This made it difficult to display KPIs which followed different units. With 1.6, it is now possible to select formatting, add prefix and suffix when customizing secondary KPIs.
3. Admin Console
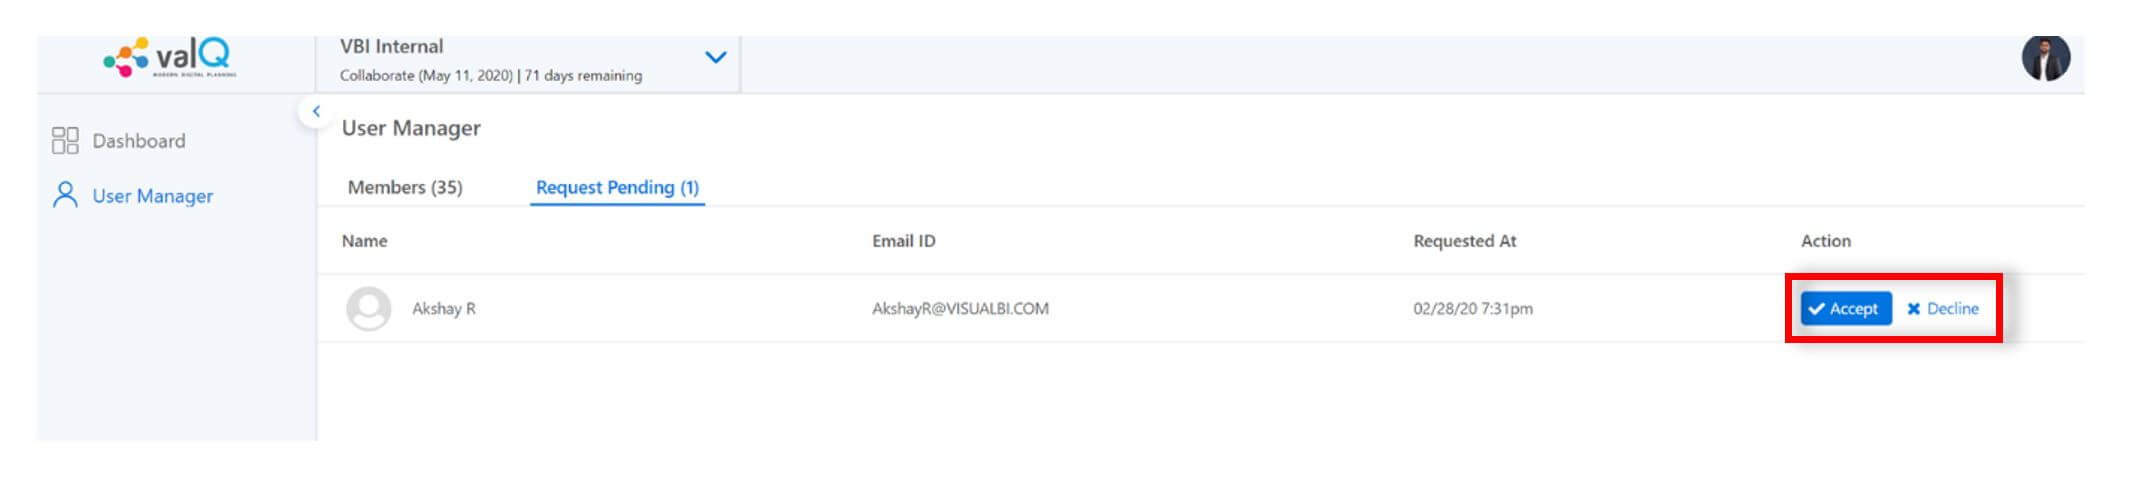
a. Request Access
Users who don’t have access to the ValQ workspace can raise a request which can be approved by the workspace admin. The ‘Request Access’ screen is shown below.

Once the request is raised, the user request can be seen in the ‘Request Access Management’ screen as shown below. The workspace admin can verify and choose to Accept/Decline the request.
b. Bulk Upload users from a CSV file
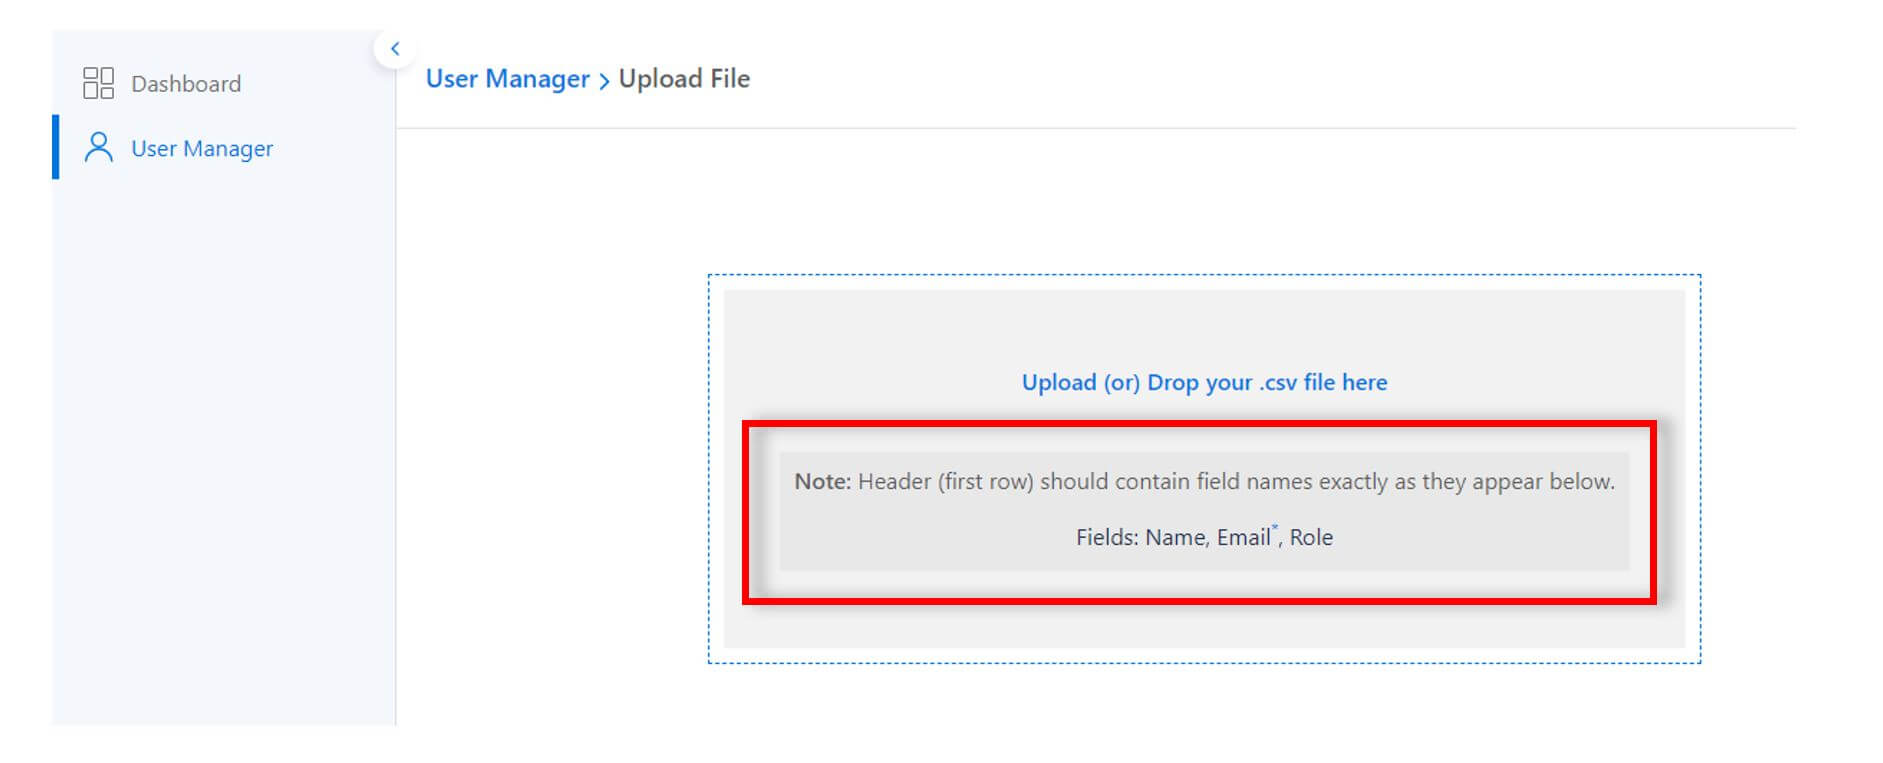
With 1.6, adding a large number of users to the workspace can be achieved by using the Bulk Upload option in the ‘User Manager’.
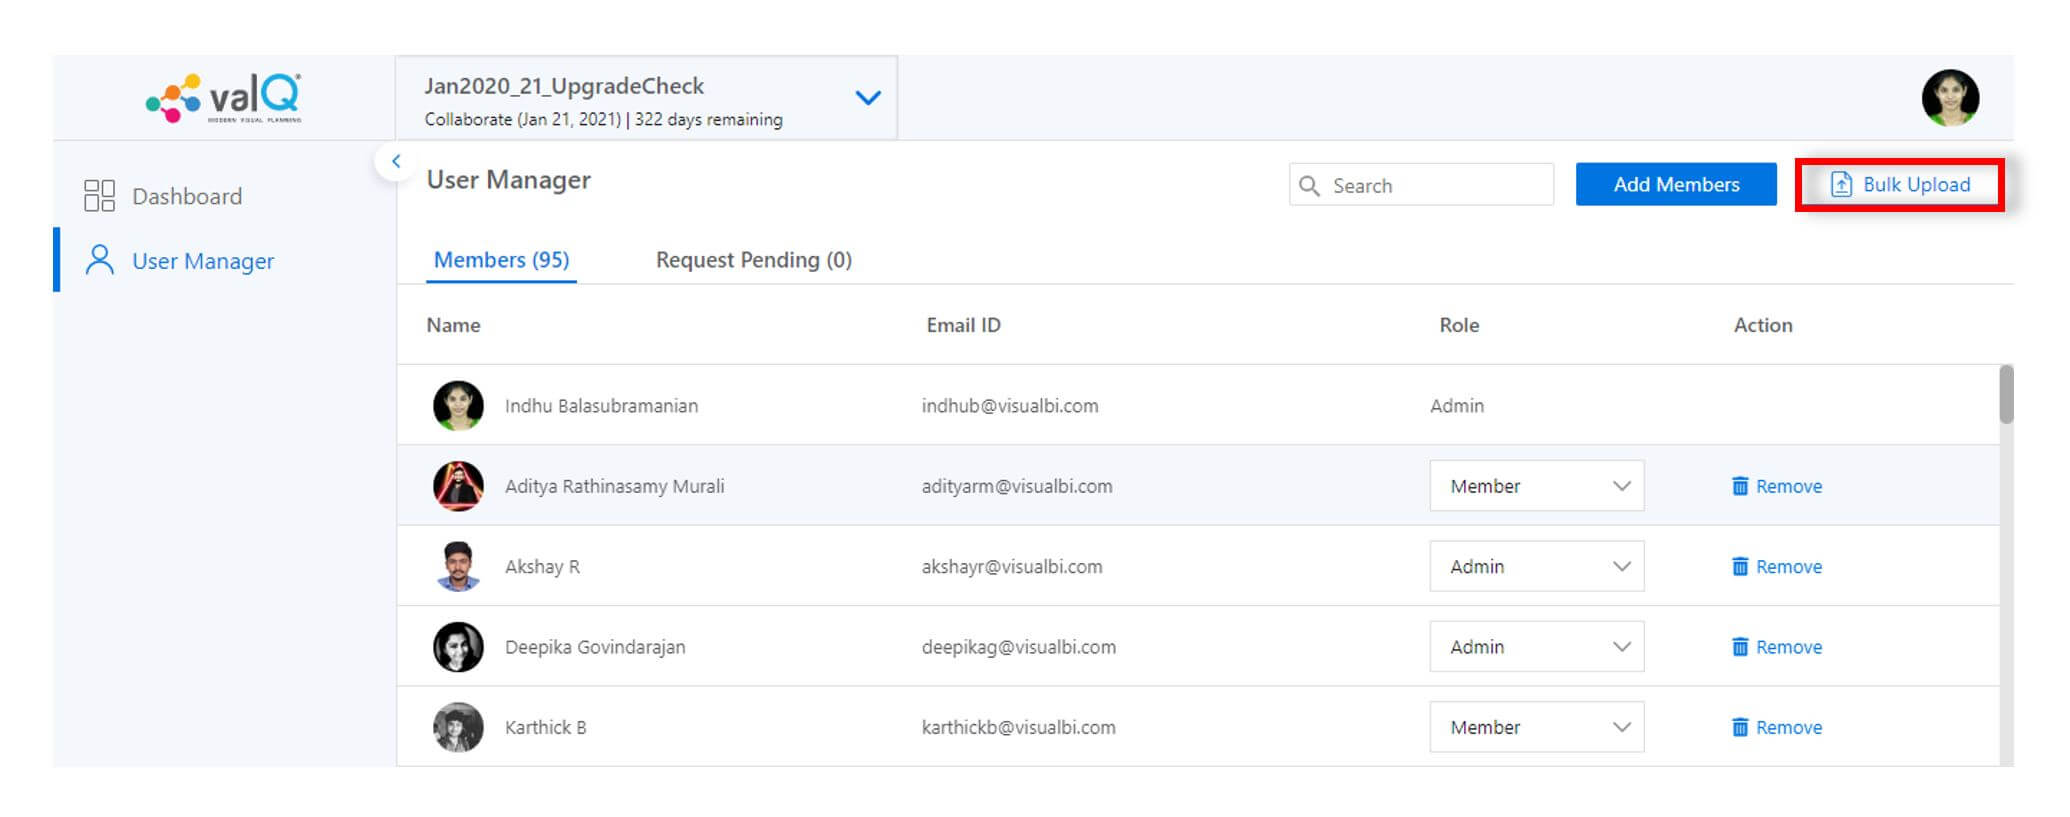
On clicking the Bulk Upload option, the following screen appears.
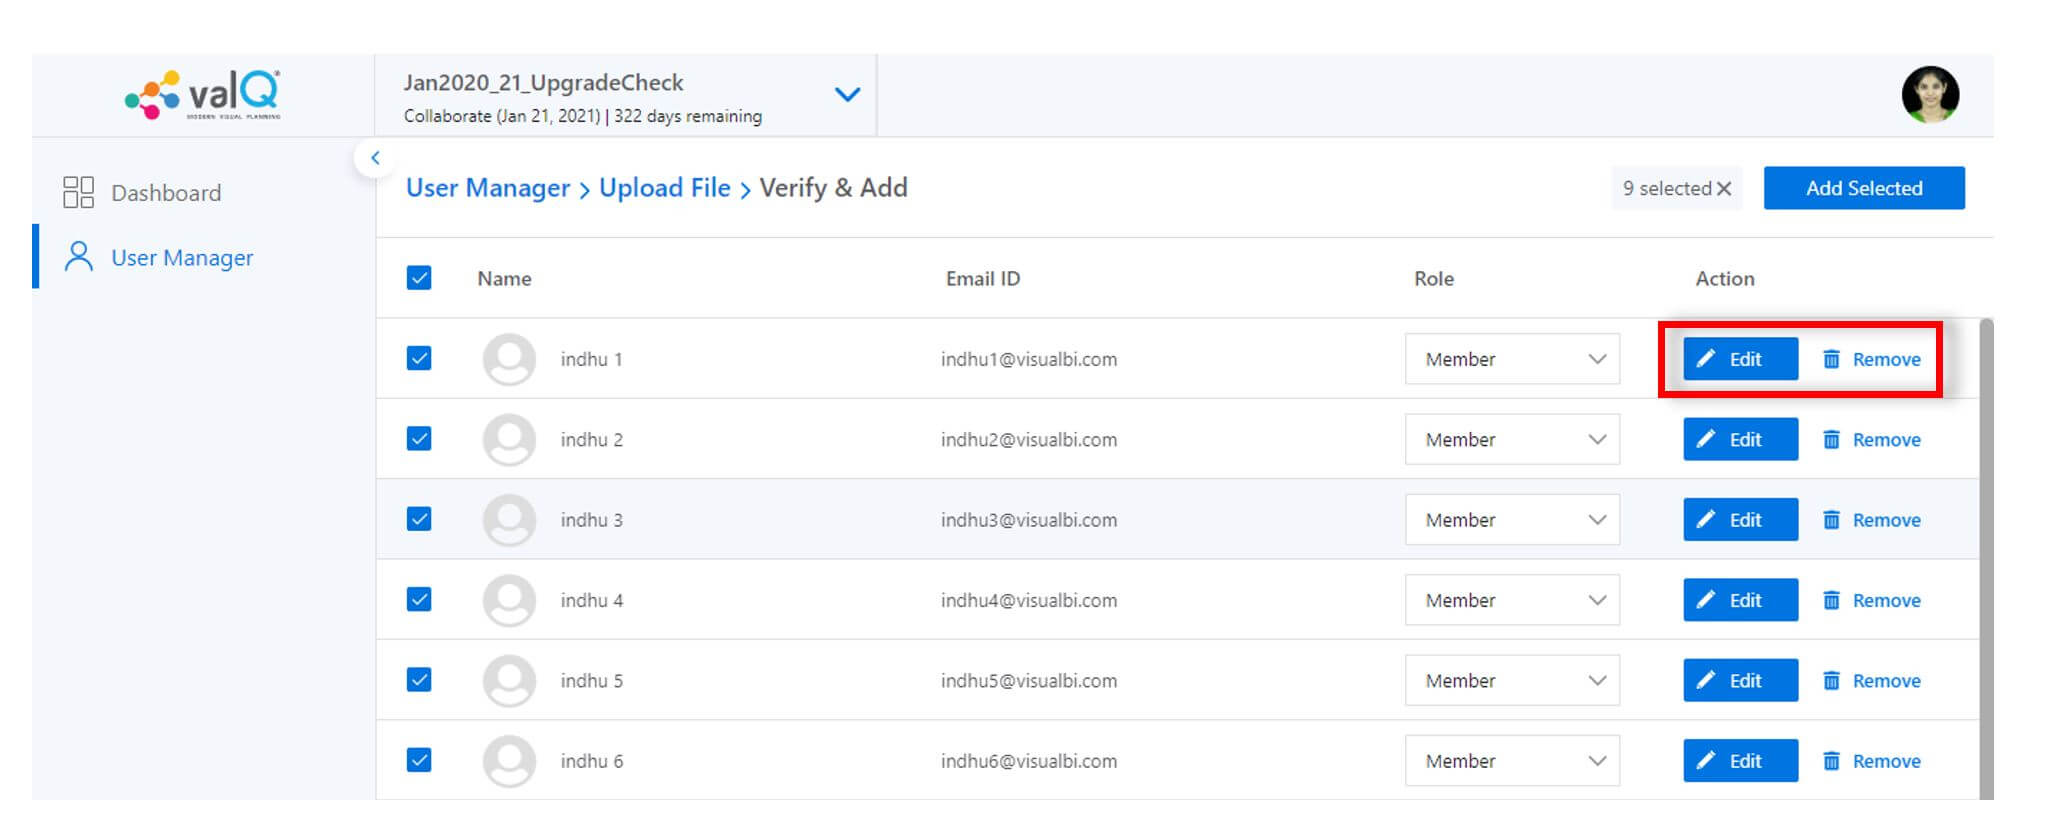
Once uploaded, it is possible to edit user details, add or remove users.
Download the latest version here and get started with ValQ today!


