
ValQ, Modern Visual Planning for Microsoft Power BI has gained enormous traction in the past few months, and here’s an update on the latest features and developments which are a part of ValQ 1.3 – currently available at the Power BI custom visual Marketplace.
Version 1.3 delivers several new features and enhancements that enable better, faster, and intuitive planning simulations. For example, we have write-back customization, handling multi-series data, exporting scenarios, conditional formatting at the node level, and many more.
Let’s look at each of them in detail.
1) Writeback customization
In the previous version, users were provided with the ability to writeback the simulation data to their native data warehouse – data across all nodes, and scenarios were labeled & loaded to the database.
With 1.3, the writeback button allows the users to choose the scenarios and nodes which are of interest, before loading the simulated data thereby avoiding data clutter and redundancy.
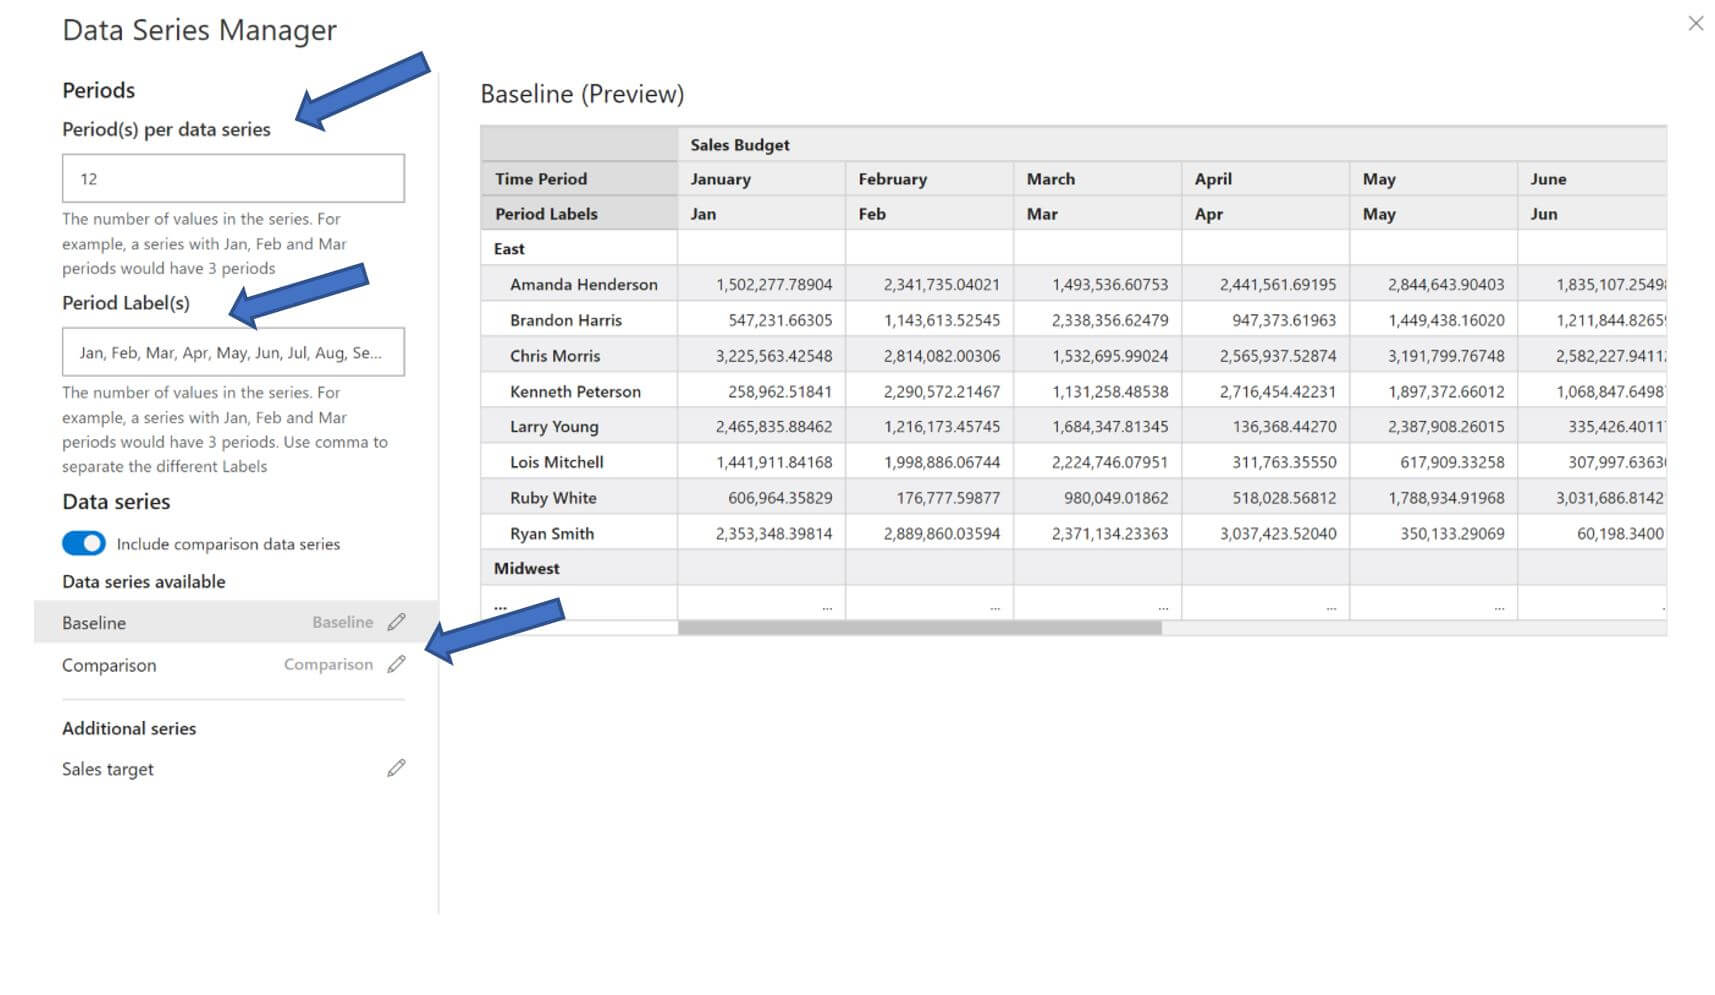
2) Handling ‘multi-series’ data
In the previous version, it was possible only to capture two series and there was no option to preview the data
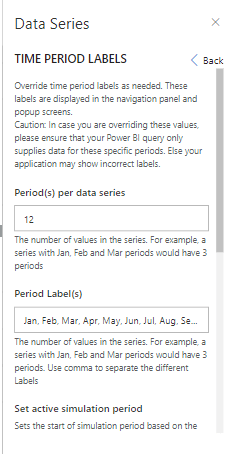
With 1.3, you have the ability to designate a primary & comparison series from a multiple set of series available for ValQ. Data for these selected series can also be previewed.
The ability to handle additional series is going to come in handy for performing variance analysis, which will be delivered in one of the future releases.
3) ‘Exporting’ scenarios
In the previous version, users were able to view the Scenario comparison report and download the data to excel by clicking on the ‘Compare scenarios in the collection’ icon.
With 1.3, users are provided with an option to download only the scenarios and nodes that are of interest
4) Conditional formatting at the node-level
Till the previous version, conditional formatting could be applied only at a global level and it was not possible to set conditions at node level.
In Version 1.3, conditional formatting has been included as a separate tab in the node editor. It comes with the following three options:
- Global:
This option allows the node to continue following global conditional formatting.
- Custom:
This option allows custom rules to be applied at the node level for the chosen node and also for all the descendants of the node (if desired). By choosing this, the global conditional formatting rules will be overridden.
- Hidden:
In case, conditional formatting is not required for some nodes, it can be hidden by selecting the hidden option.
With this option, you can now set different thresholds for your revenue vs. expense accounts and handle emerging & mature products differently and much more.
5) ‘Go to level’ – a smooth navigation on canvas
The ‘Go to level’ in the bottom left of the canvas enables navigating to the desired level without having to expand the tree manually with just a click on it.

6) Expand/collapse the navigation panel
The ability to expand and collapse the navigation panel lets you focus on the tree utilizing the entire canvas.

7) Quick switch between table and tree view from canvas
In the previous versions, you had to select the tree or table option in the navigation panel to switch between the two views.
In version 1.3, the tree/table icons in the top left of the canvas make it easier to toggle between the two views.
In addition to the above, there are several usability enhancements including a revamped configuration sheet, intuitive calculation icons in the node panel, etc.
To learn more, tune in to one of our ValQ Webinars or try our product for free here.


