
Performing a spend analysis is an indispensable cost-saving component in any business. For optimum savings, it’s always recommended to conduct Spend Analysis regularly. Spend Analysis produces high-quality actionable insights which can turn into opportunities to boost productivity and profits. In this blog, let’s understand 7 step process for conducting an efficient Spend Analysis.
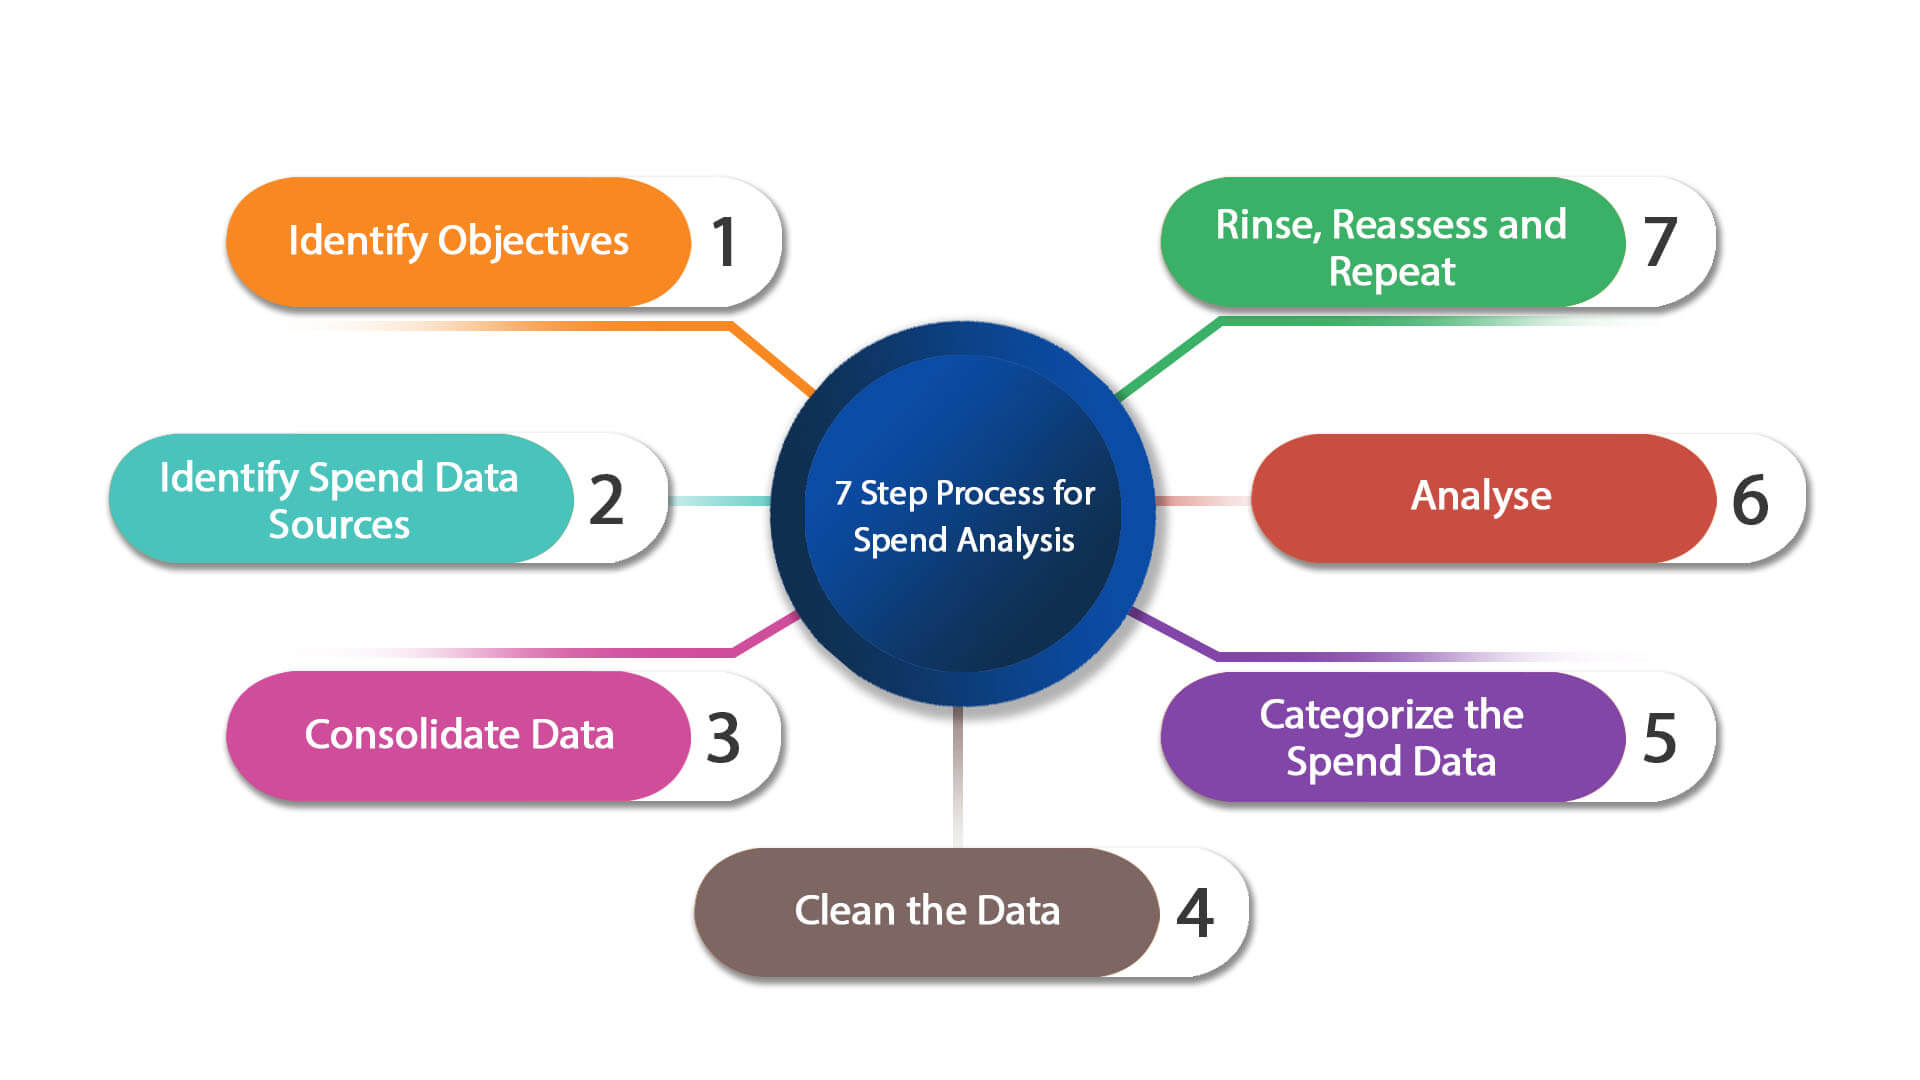
- Identify Objectives – Spend analysis can’t be a one-size fit for all business scenarios. Therefore, the first step for conducting a spend analysis is to clearly define the objectives and scope of the analysis.
- Identify Spend Data Sources – Once the goal of spend analysis is finalized, the next step is to identify all the data sources for spend-related data across different business units, departments and teams. This will help to gather and consolidate the entire spend data at one central database.
- Consolidate Data – To avoid errors, inconsistencies, duplicates and other potentially tragic data errors, the next step in the spend analysis is to ensure that there is a developed process either to transfer all information into a common format or allow all the existing data sources to communicate to one another.
- Clean the data – Once the data is consolidated, the next step is to clean the data. The cleaning process will involve finding and correcting the errors, standardization of the spend data, etc. The results of the analysis will be completely dependent on the accuracy of the dataset that’s why it is important to be thorough in this step.
- Categorize the spend data – This step includes the classification of spend data into different categories, grouping suppliers together based on purchase data, payment terms, frequency of purchase, spend categories, etc.
- Analyze – Now, the insights from the spend data are compared with the standard spend analysis – key performance indicators. In this step, it’s crucial to conduct a proper classification of spend data in different categories like direct spend, indirect spend, maverick spend, etc. Successful analysis results in numerous benefits for the end-users. Learn more about the benefits of spend analysis here.
- Rinse, Reassess and Repeat – Spend analysis is a dynamic process. The objectives of spend analysis, the data sources used, the data format, etc will always keep evolving. The insights revealed by spend analytics can be used to pursue the set goals and at the same time, the entire 7-step process can be repeated regularly as the data grows and new objectives are identified.
Download the latest version of ValQ here and get started with ValQ Plan today.


