/

Significance of Cost to Serve

ValQ
November 24, 2021

Cost to Serve analysis helps an organization to get clear visibility if a customer is contributing to the bottom line or not. It facilitates informed decisions to transform unprofitable customers into profitable ones. Organizations can have better control over different commercial strategies, improve and optimize high-cost processes.

Classifying existing clients into four quadrants based on the cost to serve analysis and revenue can give great insights into where each customer stands and which strategies the company should adopt to improve profitability. Refer to the below figure for the classification.

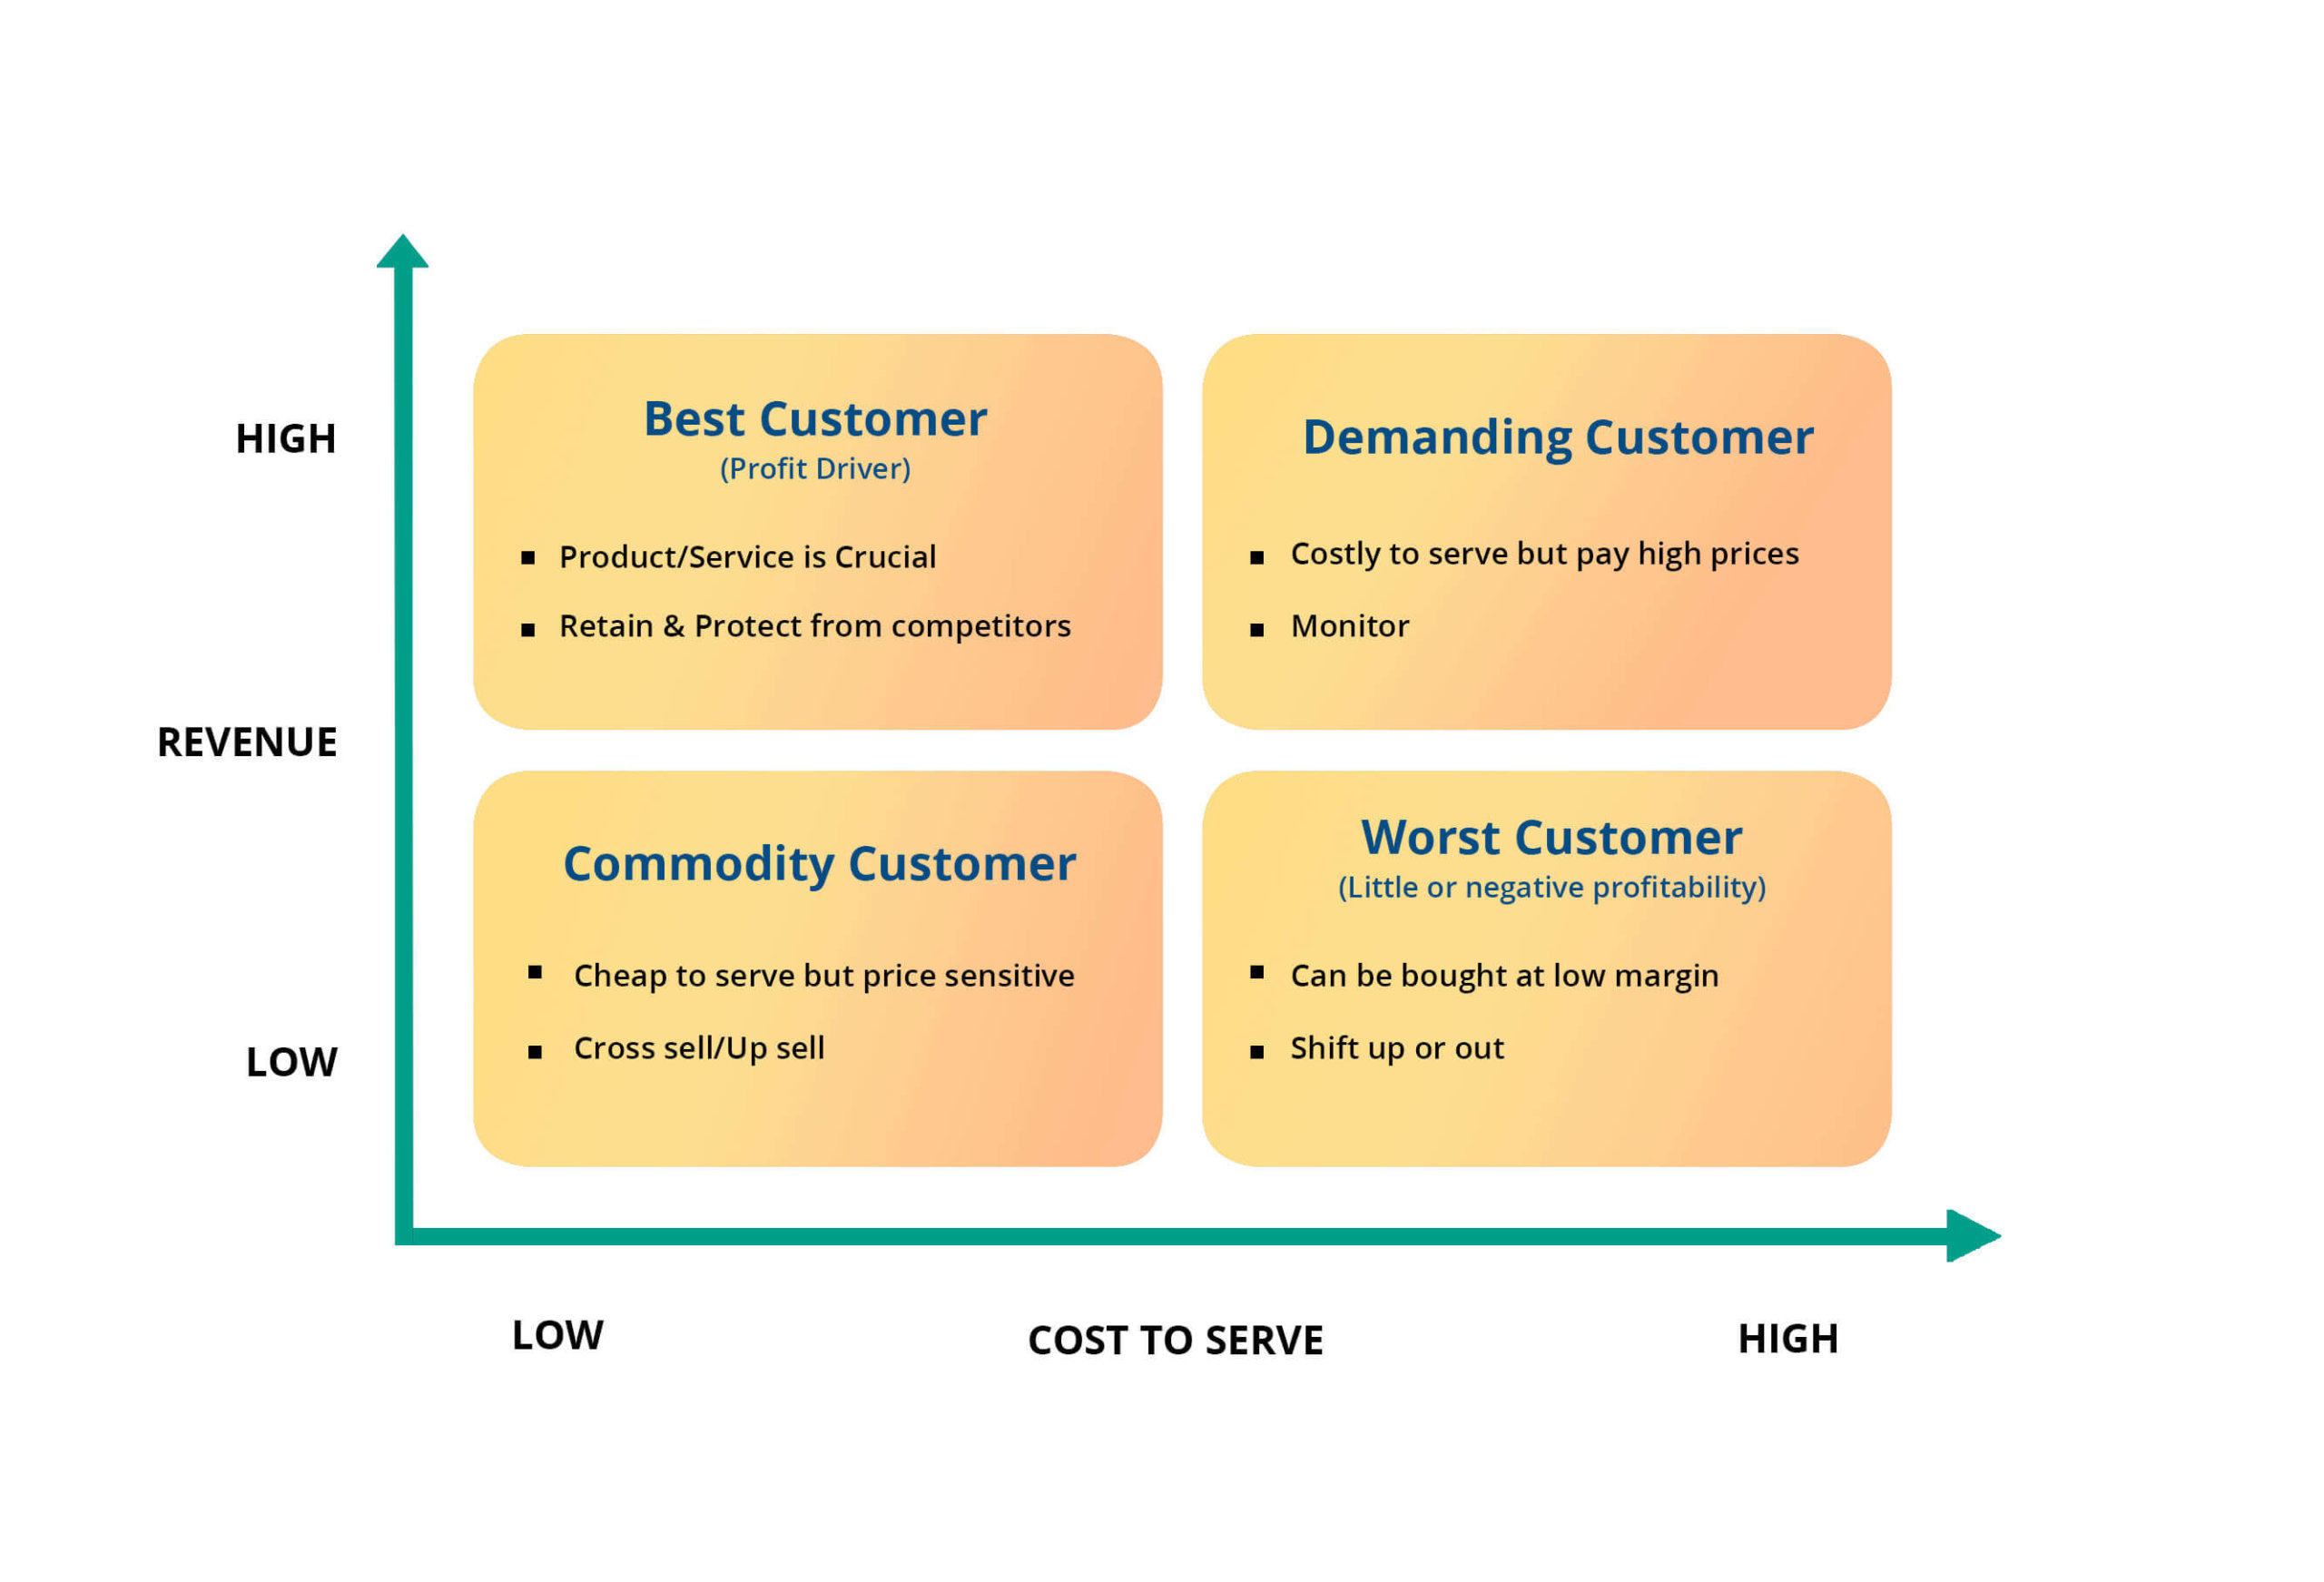
Analysis of the above quadrants helps organizations to estimate strategic opportunities to make all customers more profitable. Some of these opportunities could be:

  1. Restructuring distribution channels.
  2. Renegotiation with customers.
  3. Shifting customers’ interest to richer and higher-margin products.
  4. Gain more volume with low cost to serve customers through discounting.
  5. Identifying price-raising opportunities.
  6. Abandoning products, services, or customers.

Try out the free demo for Cost to Serve Analysis using Microsoft Power BI here.

To learn more about Cost to Serve Analysis, Click here.

Download the latest version of ValQ here and get started with ValQ Plan today.

Get ValQ brochure

Discover the incredible power of dynamic and collaborative business planning with ValQ
Download now

Visualize and analyze business outcomes with ease

Discover how ValQ delivers agile, interactive and intuitive business planning.
Request a Demo

Get ValQ brochure

Discover the incredible power of dynamic and collaborative business planning with ValQ
Download now

Visualize and analyze business outcomes with ease

Discover how ValQ delivers agile, interactive and intuitive business planning.
Request a Demo
ValQ
About ValQ!
ValQ empowers analysts, executives and decision-makers across departments and functions. Model any business scenario in minutes, build complex business plans, what-if simulations, create & compare budgets, forecasts and scenarios – all within Microsoft Power BI. The product is developed by Lumel Technologies (formerly Visual BI), which has a decade of experience in building add-on solutions on top of BI platforms (SAP BI and Power BI) with our suite of innovative products such as xViz and Inforiver.

Headquarters

5920 Windhaven Pkwy, #130
Plano TX 75093
Inforiver
xViz
cross linkedin facebook pinterest youtube rss twitter instagram facebook-blank rss-blank linkedin-blank pinterest youtube twitter instagram