
Value Driver Trees are a good tool to use for modeling business scenarios and allow you to visualize the flow of a business or its operations. More importantly, these visualizations allow analysts to map their key operational processes to their most important business KPIs by establishing logical and/or mathematical relationships between them. Thus, they allow users to drilldown and slice & dice data from the topmost level of their business pyramid and find insights that may not be obvious or even represented on a traditional report or dashboard. This could also include simulations and what-if scenarios. One of the key elements for a good value driver tree is the flexibility to map any data that a business analyzes into the tree form. While traditionally, Value Driver Trees are only expected to show the operational drivers and business KPIs, a truly flexible model needs to allow a little more slice and dice capabilities – such as the ability to drilldown into one of the drivers and take a look at the key factors that contribute to that driver’s value. Visual BI’s ValQ for SAP and Microsoft Power BI brings this capability to end users, allowing them to map drilldown data to a particular node on the value driver tree using what is called a “Dimensional Node”.
What is a Dimensional Node?
The best way to explain the concept of a “Dimensional Node” is an example. What we could do here is to take an example of a typical process industry – such as a Copper Mining business – in which any of the operational drivers could be a constituent of multiple factors. First, here’s the tree itself:

In our scenario, we are modeling the Value Drivers that contribute to the Net Profit of the organization, and you can see that it’s broken down into Revenue and Cost elements. For more simplicity, the focus here is on the highlighted path that follows the breakdown of Total Costs. In this example, one of the key elements that dictate costs is the Mill Throughput, and one of the key factors deterring throughput are Internal Delays.
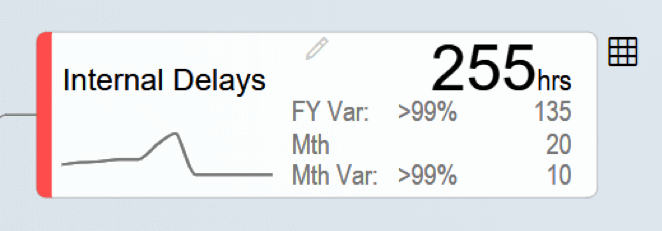
A term as generic as “Internal Delays” may be acceptable for quick What-If scenarios that high-level business users may want. However, in certain cases, an analyst taking a closer look or following a more realistic simulation path may seek more insights into the term – they may want to take a look at what exactly “Internal Delays” mean, and how we arrived at the figure shown. To give this ability to a business user, the modeler can incorporate this particular node as a “Dimensional Node” which basically gets all of its data from a different data source, if needed, but, can also be aggregated and included as part of ValQ as a single node. An abstract of this concept has been represented in the figure below:
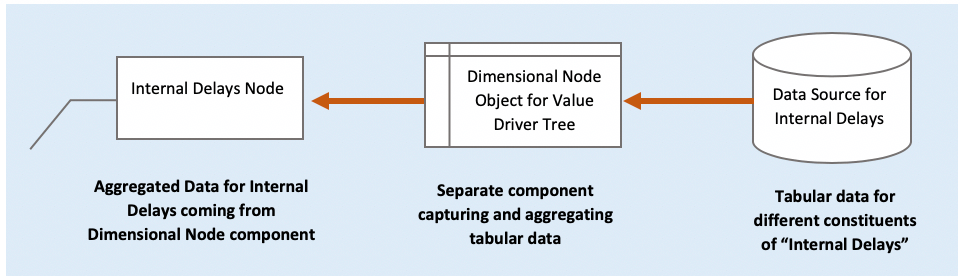
In this example, the scenario described has been modeled by first creating a “Dimensional Node” component within the ValQ application and using a BW data source to get the Internal Delay detail data into the component. Subsequently, this Dimensional Node component has been consumed within the ValQ model. When an end user wants to drilldown to see the detail data, all they will need to do is click on the “Table” icon right next to the node. They are presented with a popup window showing them the drilldown details, which would look something like this:
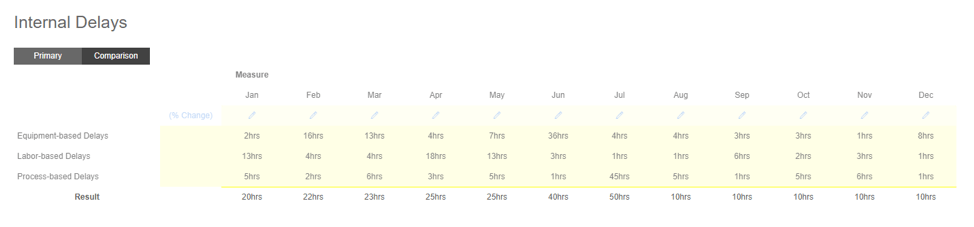
If required, a comparison series for each of the constituent dimension members can also be displayed on a separate tab without much effort – this simply needs to be included as part of the data source.
When does use of a Dimensional Node instead of child nodes make sense?
When running What-if scenarios using ValQ, a concise view of the most important drivers is necessary to minimize the scrolling required to follow the impact of simulations across multiple nodes. When including child nodes that are inconsequential to a high-level user, this purpose may be defeated, making the tool a little more cumbersome to use. This, of course, is merely one part of the problem. Another important reason for this is, if the number of constituent members of a driver is large, there would be too many child nodes, thereby cluttering the tree when it is not really necessary. For example, let’s say that one of the nodes being modeled is the total sales for all products. If one were to include all the products and their individual sales as child nodes, this could end up adding dozens or hundreds of extra nodes to the tree. In such cases, the Dimensional Node is a concept that can introduce a lot of flexibility.
Note : Dimensional node is available for Lumira and not for Power BI version.
***
ValQ is Visual BI’s solution for business modeling. It is an innovative self-service business planning and simulation solution that lets you instantly visualize and optimize profitability & growth. ValQ is designed to enable executives, decision-makers and business analysts to seamlessly connect to data to make effective decisions. ValQ is fully customizable, mobile-compatible and has a highly engaging and intuitive interface. It is now available for SAP and Microsoft Power BI.
In our other blogs, we’ll review more topics of interest such as tips on getting the most out of value driver trees, best practices, how-to recommendations, software evaluation considerations, exciting features of ValQ and more.
To learn more, tune into one of our ValQ Webinars or try our product for free here.


