
ValQ by default leverages a standard fiscal year (Jan to Dec) for time periods. However, you can use customized time periods (e.g. 16 weeks, 6 Quarters, 5 Years, etc.) and the fiscal year (e.g. Apr to Mar) too.
In this blog let’s look at how to set up ValQ to handle the following;
- Custom Fiscal Year
- Custom Weeks (an even more generalized approach that would work for quarters, years and days as well)
Handling A Custom Fiscal Year
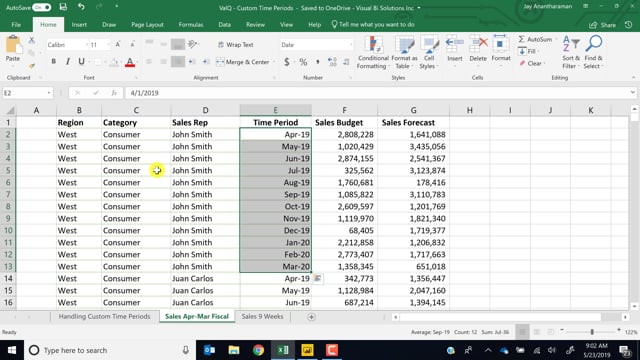
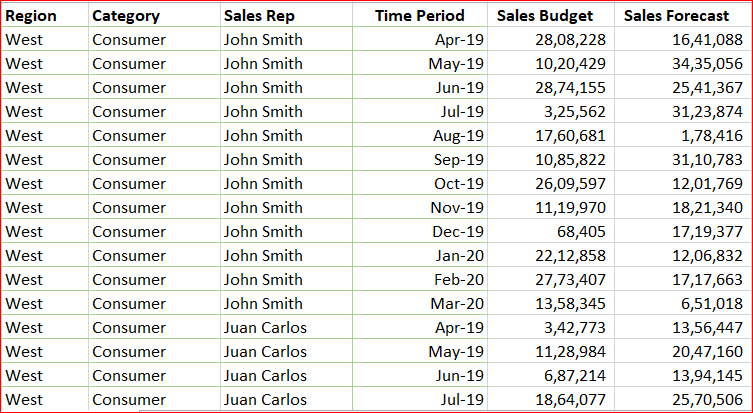
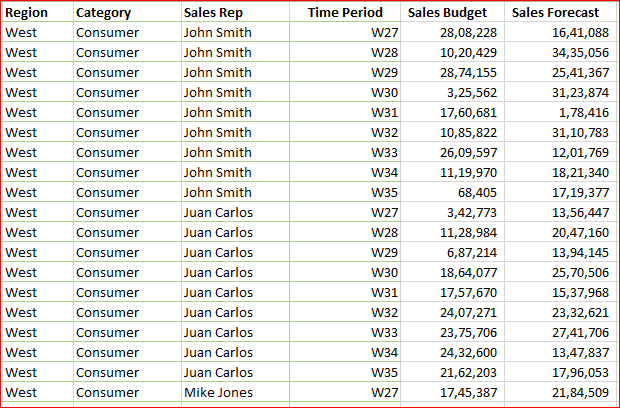
1. We are going to use the sample dataset available here. Note that we have sales budget & forecast data for April 2019 through March 2020 for combinations of Region, Category and Sales Rep.
2.Import the dataset into Microsoft Power BI
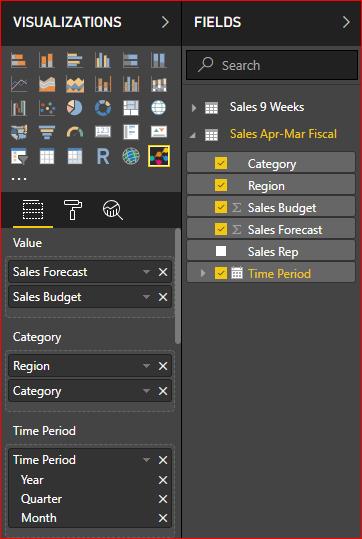
3. Activate ValQ and create a simple dynamic model. Assign the properties to Value, Category and Time Period fields as shown
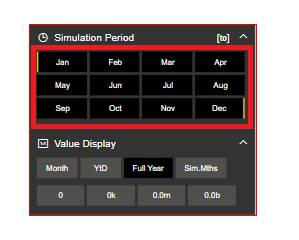
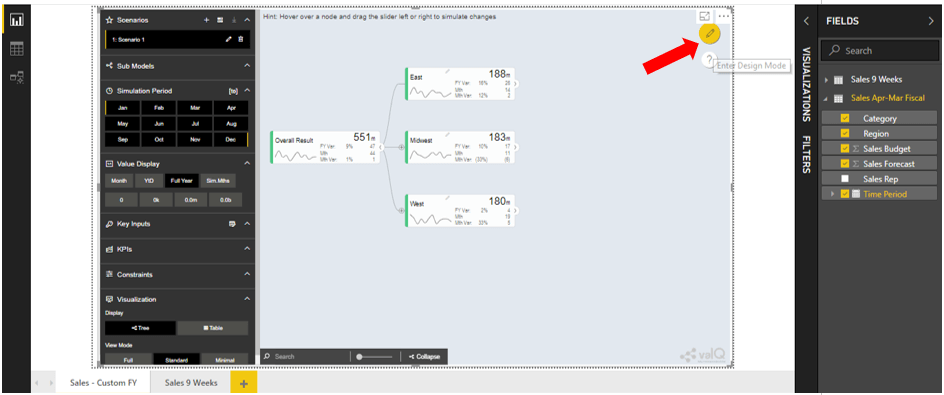
4. Once done, you will observe Simulation Period reflecting as Jan through Dec
5. Click on the ‘Enter Design Mode’ icon in the Canvas
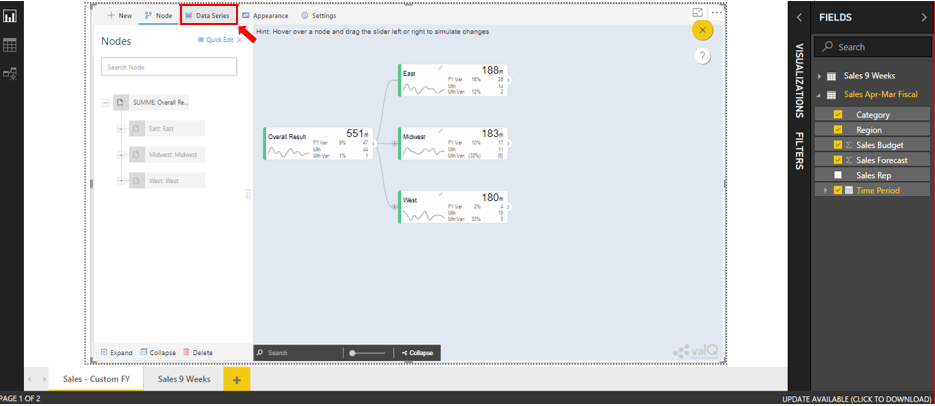
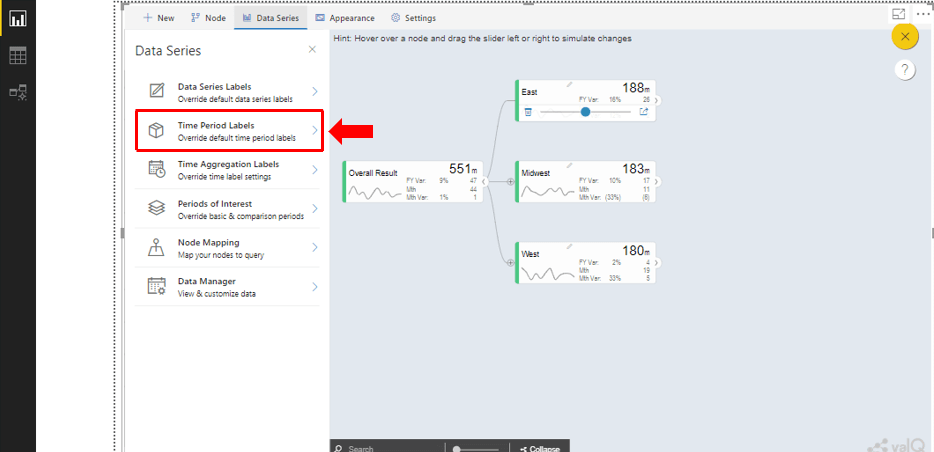
6. Select Data Series -> Time Period Labels
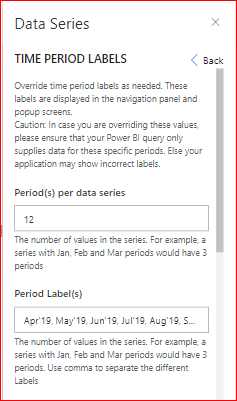
7. Retain Period(s) per data series as 12 (since we are continuing to have 12 months in the fiscal year). However, on the Period Label(s) field, enter the values Apr’19 through Mar’20 separated by a comma – this would automatically map to the 12 periods in the data series
8. Save changes. When you return to the runtime view by selecting ‘Exit Design Mode’. You would see the value of the months in the simulation period updated now
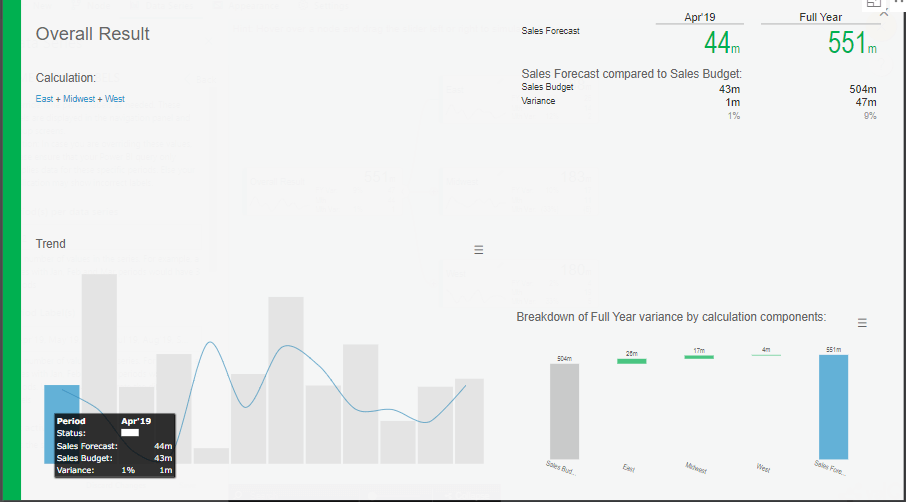
9. Now click on any node in the canvas to get the popup. Inspect the columns in the combination chart. When you mouse-over, you would see the new month values in the tooltip as well
With this, you have successfully customized ValQ to handle custom fiscal year period.
Handling Custom Weeks
Handling custom weeks is very similar to that of using a custom fiscal year, but with some extra steps.
Use the file provided here that captures data for 9 weeks (week #27 to #35). Follow the steps from #1 through #6 as outlined above for setting up the custom fiscal year.
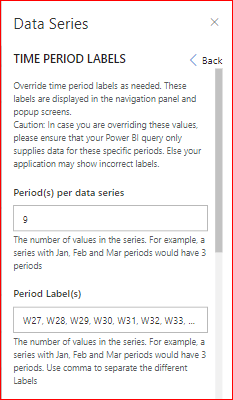
- In ValQ, go to the design mode and visit Data Series -> Time Period Labels. Enter ‘9’ in the field Period(s) as we have data for only 9 weeks
- Populate the field, Period label(s), with week identifiers separated by commas (W27, W28, W29, W30, W31, W32, W33, W34 & W35)
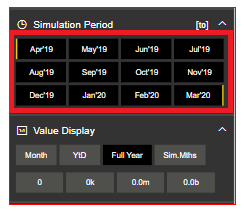
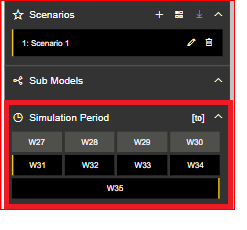
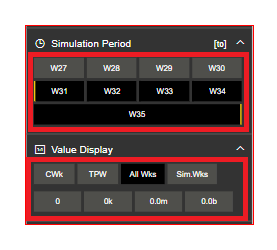
4. Save changes. If you exit the design mode, you will see that the Simulation Period would now show 9 weeks.
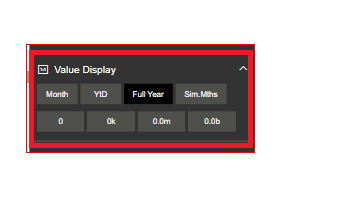
5. Now we need to perform an additional step of adjusting the Value Display labels, which is still showing values applicable for monthly data
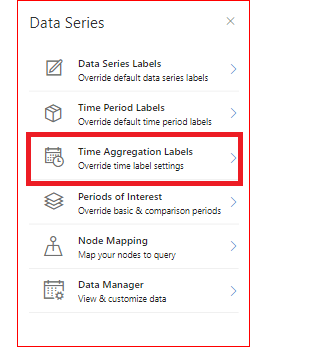
In the design mode, Go to Data Series -> Time Aggregation Labels
6. You would see four items: Active Period, Till the Prior Period, All Periods & Simulation Period.
Change them as follows.
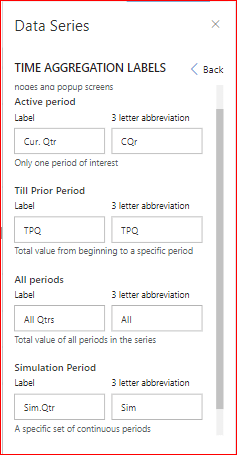
The 3-letter abbreviation is used on the nodes in the canvas, while the full values are shown in the Value Display section and in the popup screens.
- Save changes. Once changes are done, the Navigation panel would display as shown below.
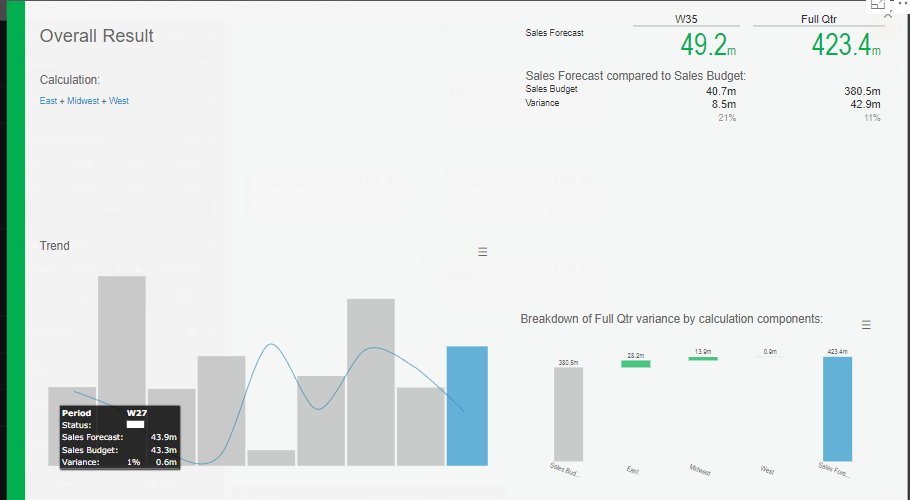
Click on any node to see the changes made. Not only would you see the week data on the combination chart tooltip, but you would also see the week number & ‘All’ called out on the header of the table on the right.
With this, you have successfully learned how to handle custom time periods in ValQ. If you would like to get started with step-by-step instructions, visit our page here.
To learn more, tune into one of our ValQ Webinars or try our product for free here.


