
Quite often you may build a ValQ model that requires a cluster of nodes repeating several times within the same model. For example, when you try to review P&L for each product category in your portfolio, the P&L structure would get repeated for each product in your ValQ model.
Under such conditions, defining the P&L structure as a template and reusing the template helps you not only build the model faster but also allows for easy modifications to the structure in a single place. This is now possible using ‘Template Structures’ in ValQ.
* * * *
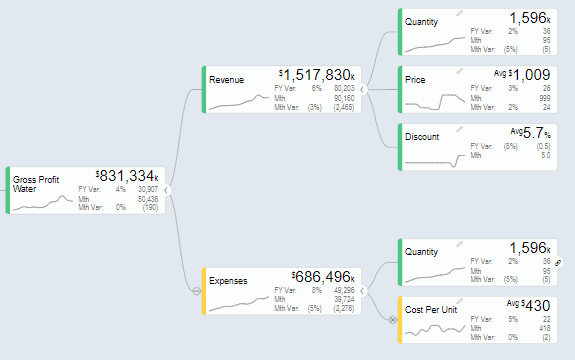
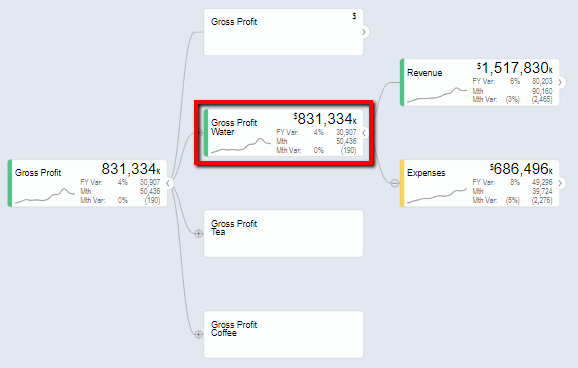
Let’s take an example where there are three different product categories – Water, Tea and Coffee and you need to calculate the overall gross profit.
The Gross Profit P&L structure for Water is as shown below. This structure would repeat itself for Tea and Coffee.
Let’s now see how to build template structures using ValQ. We’ll first take a look at the data, then build the template structure before finally reusing it across the model.
1. Data Format
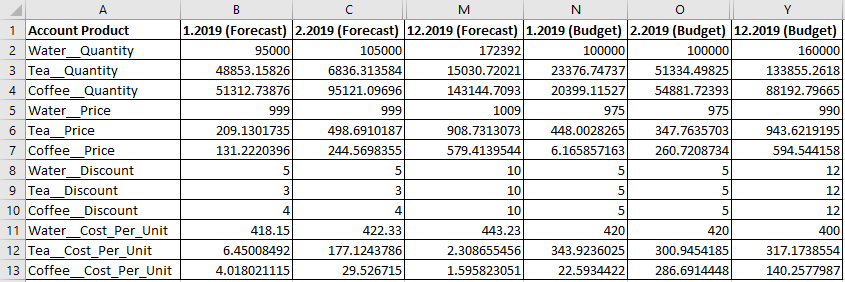
For ValQ to recognize the product category and P&L data, they need to be provided in a format that concatenates Product Category and Account with two underscores separating them. For example, the price of coffee will be identified as Coffee__Price.
In the following datasheet, we have 12 months of forecast and budget data for Quantity, Price, Discount and Cost per unit for each product category.
2. Building the template structure
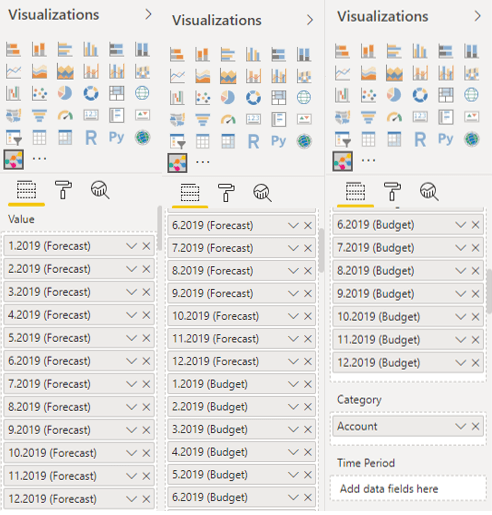
- Import the data and assign the 12 months forecast and budget data to the ‘Value’ field and ‘Account Product’ to ‘Category’ field in the order shown below.
- Close the ‘Getting Started’ popup.

- Click on ‘Create an Advanced Model’.
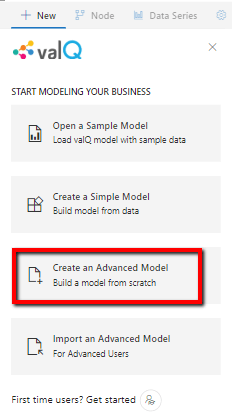
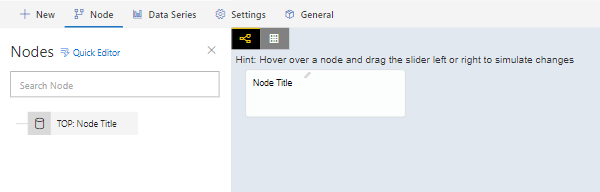
- You can see the following screen.
- Double click on the node or click on the pencil icon next to the node to rename the nodes.
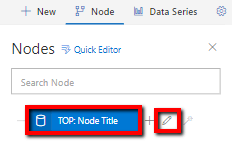
- The ‘Edit Node’ screen opens. Rename the node by entering the ‘Title’ as ‘Gross Profit’. Click ‘Finish’.

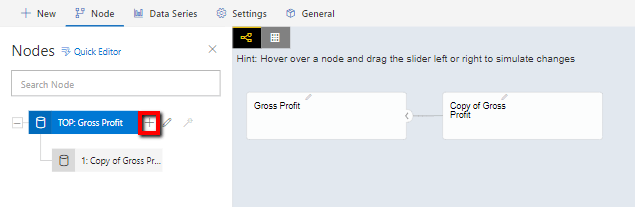
- Click on the ‘+’ icon to add child nodes.
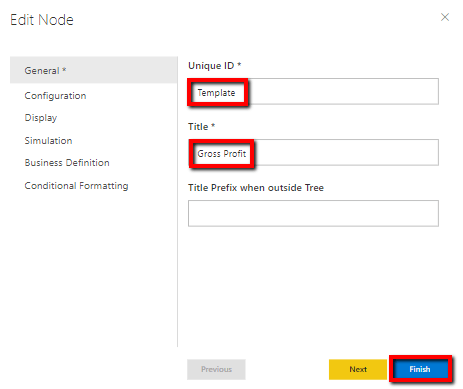
- Double click on the node. Enter ‘Template’ in the ‘Unique ID’ field and ‘Gross Profit’ as ‘Title’. Click ‘Finish’.
- The node gets renamed.

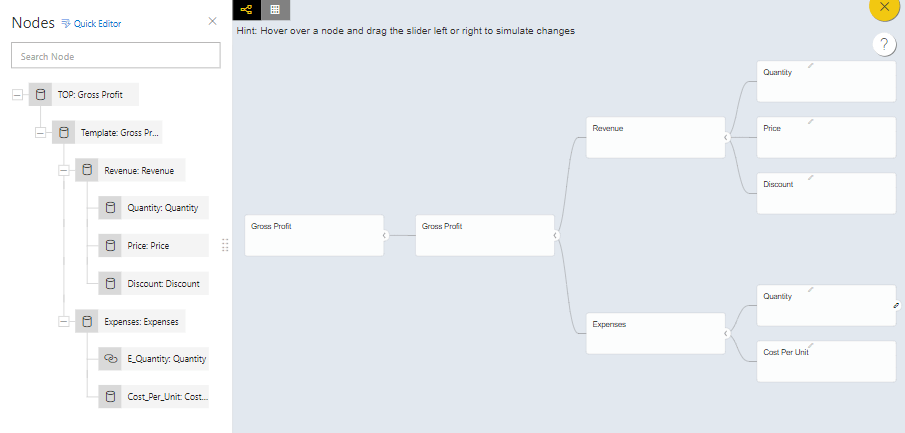
- Similarly create child nodes by clicking on the ‘+’ icon of the immediate parent and rename them by clicking on the node and editing in the ‘Edit Node’ screen as shown in the image below.
Next step would be to configure the nodes. Double click on the node. In the ‘Configuration’ tab of the ‘Edit Node’ screen, select the ‘Calculation Method’.
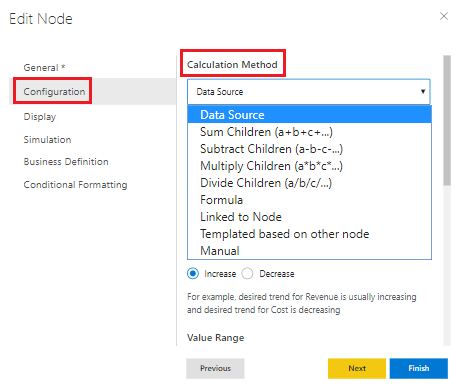
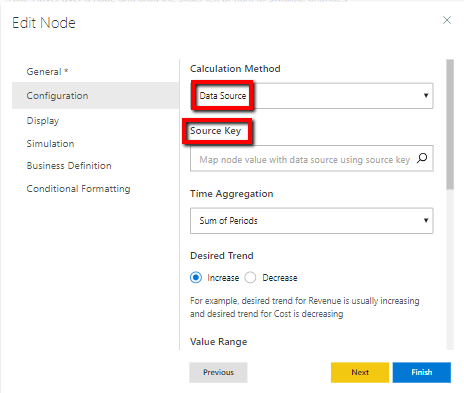
When assigning a calculation method, only the formulas or linked nodes have to be mentioned. If a particular node consumes data from the data source, the ‘Source Key’ field should be left empty as this is only the template.
Assign the calculation methods to all the nodes as mentioned below;
1. Quantity in the Revenue sub-tree, Price, Discount and Cost Per Unit are data sources.
2. Revenue is defined as Quantity*Price*(1-(Discount/100)).
3. Quantity in the Expenses sub-tree is linked to the Quantity in the Revenue sub-tree.
4. Expenses are defined as Quantity*Cost Per Unit.5. Gross Profit is the difference between Revenue and Expenses.
6. The top node TOP: Gross profit is the overall gross profit and is the sum of the gross profit for water, tea and coffee.
Also, wherever needed assign prefixes, suffixes, scaling etc. Once configured, the tree looks like the one shown below.
3. Building the tree
Now to create the Gross Profit nodes for each product category, add three child nodes to the top node and rename them.

Let’s first configure the Gross Profit Water node. Follow the steps mentioned below;
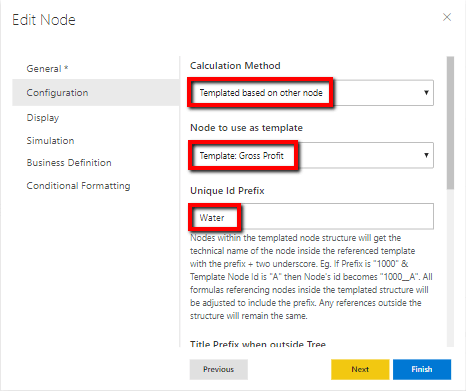
1. Double click on the node. The ‘Edit Node’ screen opens.
2. In the ‘Configuration’ tab, in the ‘Calculation Method’ field, choose ‘Templated based on other node’.
3. In the ‘Node to use as template’ field, select ‘Template: Gross Profit’.
4. Enter ‘Water’ as the ‘Unique Id Prefix’.
5. Click ‘Finish’.
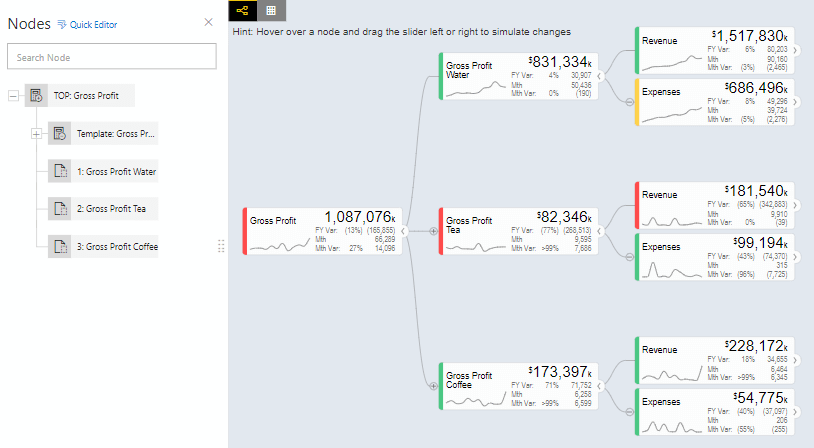
Gross Profit Water node gets activated in the canvas.
Similarly configure the other nodes, Gross Profit Tea and Gross Profit Coffee.
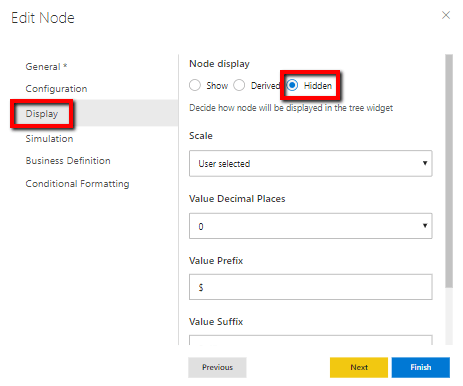
And also hide the template node by changing the ‘Node Display’ in the ‘Display’ tab of ‘Edit Node’ screen to ‘Hidden’.
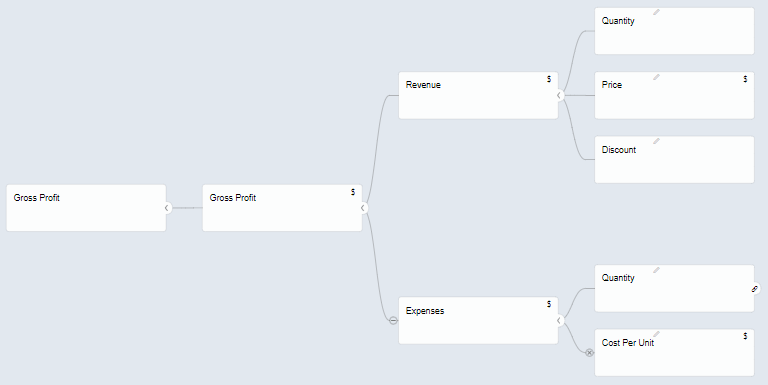
The final tree is shown in the image below.
To learn more, tune into one of our ValQ Webinars or try our product for free here.


