
ValQ democratizes planning for the digital enterprise in the modern self-service era. It empowers finance, operations, sales, marketing, human resources and procurement to instantly and visually identify, measure and optimize business performance. ValQ is now available for SAP & Microsoft Power BI.
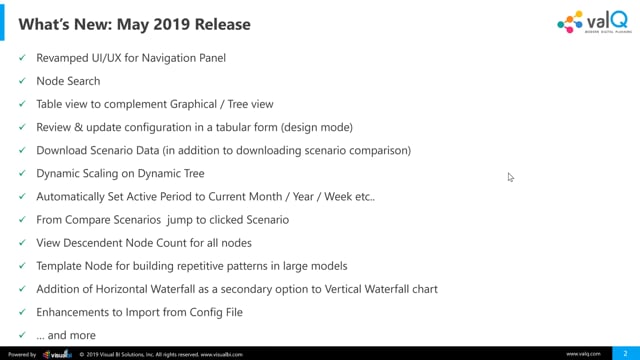
In this blog, let’s take a quick preview of the new features that are part of ValQ’s May 2019 release:
1. New Simulation-Enabled Table View (in addition to the Standard Tree View)
The Table View lets users consume ValQ models in a tabular format.
Through our surveys, we realized that despite having the tree view, quite a few power users also preferred to view the data in a tabular format. While we were at it, we added simulation capabilities to the table as well, so that users can seamlessly switch between the tree and tabular views, without having to lose track of the individual simulations and their impact.
Similar to a Tree View, Table View also comes with Full, Standard and Minimal formats – thereby giving users even greater control on choosing the level of detail to be displayed.

While clicking on the KPI name, the same popup-screen shows up here as well.

2. Search by KPI name
Till now, there were a few options to navigate to a specific node –
- By organically expanding the tree – which becomes cumbersome for large trees
- Using the navigation panel on the left – however, only the key nodes are covered here
- Through the change tracker on the top left of the canvas – but this happens only after you have been to the node at least once.
ValQ now has a new Search option at the bottom left of the tree canvas that enables users to search for any node and jump to that node instantly. Search is also available in the tabular view. Both these options now significantly enhance the ease of navigation & access.

3. Quick Editor – Spreadsheet Like Experience
This design-time enhancement allows users to view and edit all the KPI configurations from a single place with greater ease. Until now, you had to select and dive into a specific node and configure its properties. The Quick Editor gives you a 10,000 ft view so that you can perform several changes at once.
4. Download Scenario Data
Until now, users were able to download the results of scenario comparison based on a limited set of factors. With this new release, you will be able to download the results of the entire simulation to a spreadsheet.
5. Other Latest Features
In addition to the above, there are several other features available as part of the May 2019 release, such as,
- Enhanced UI/UX for navigation within the model
- Switching between scenarios on the fly during comparison
- Dynamic scaling on dynamic models
- Option to view descendant node count for all nodes
- Dual modes for waterfall chart displaying variance & simulation breakdown.
- Template Nodes to reuse repetitive patterns in large models
- … and more.
To learn more, tune into one of our ValQ Webinars or try our product for free here.


