
The History of Value Management
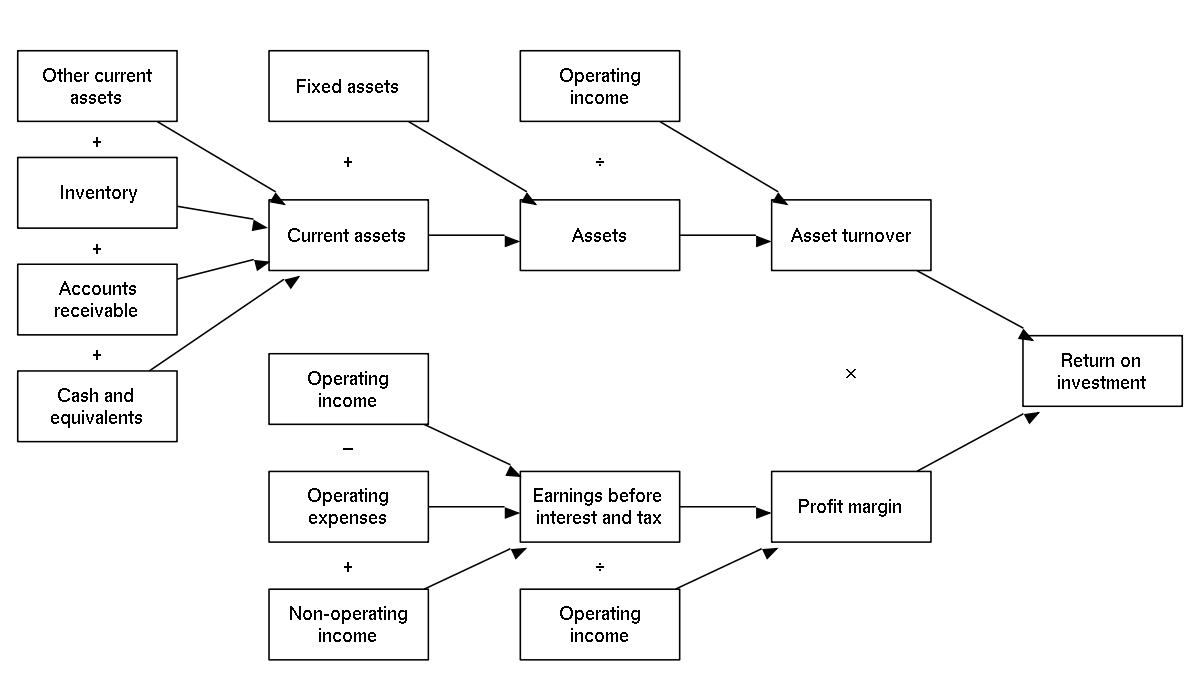
The Value Driver Tree traces its origin to 1920s, when DuPont used a visual model to define Return on Investment (ROI) as a function of profitability, asset turnover and financial leverage – all of which were broken down further. The model helped the firm understand the impact of changes to various key parameters on the overall outcome.
The model was revolutionary, not because of the tree-like visual analysis but because of the way in which a new metric (ROI) was defined in terms of elements from both the income statement & the balance sheet.
From here, the model spread to General Motors (DuPont invested in GM) , and subsequently to Ford. Several innovative and ‘new age’ ways of measuring business performance began to emerge, with a new breed of processionals developing the know-how to deploy such advanced statistical and analytical performance management techniques. Ultimately, these factors led Ford to cede control of the business to professional managers in the 1950s.
* * *
In the subsequent decades, several approaches to value management emerged in the business world such as value based management (VBM) and economic value added (EVA). The evaluation, implementation, data gathering, performance measurement and monitoring of these techniques required immense efforts & focus from enterprises, thereby mandating the need for such initiatives to be blessed by the C-Suite. As a result, such tools remained exclusively in the corridors of CXOs, and under the able guidance of leading management & strategy consulting firms.
In the recent few years, the emergence of various easy-to-use and high-performance data analysis toolsets have revived interest in value management frameworks. Technological innovations have made it possible for even line managers and mid-level executives to apply such techniques to operational business scenarios within their departments and teams. The ubiquitous need for performing what-if scenario modeling & analyses, combined with the ability to visualize results intuitively has revived tremendous interest in these frameworks, specifically the Value Driver Tree.
* * *
What is a Value Driver Tree?
In essence, the Value Driver Tree is a visual representation of a conceptual business model that links a business value (what management or stakeholders care about, e.g. Profit) to a set of drivers (any variable that can affect the value, e.g. Planned downtime or Sales Price). A representative value map of a business is provided below.
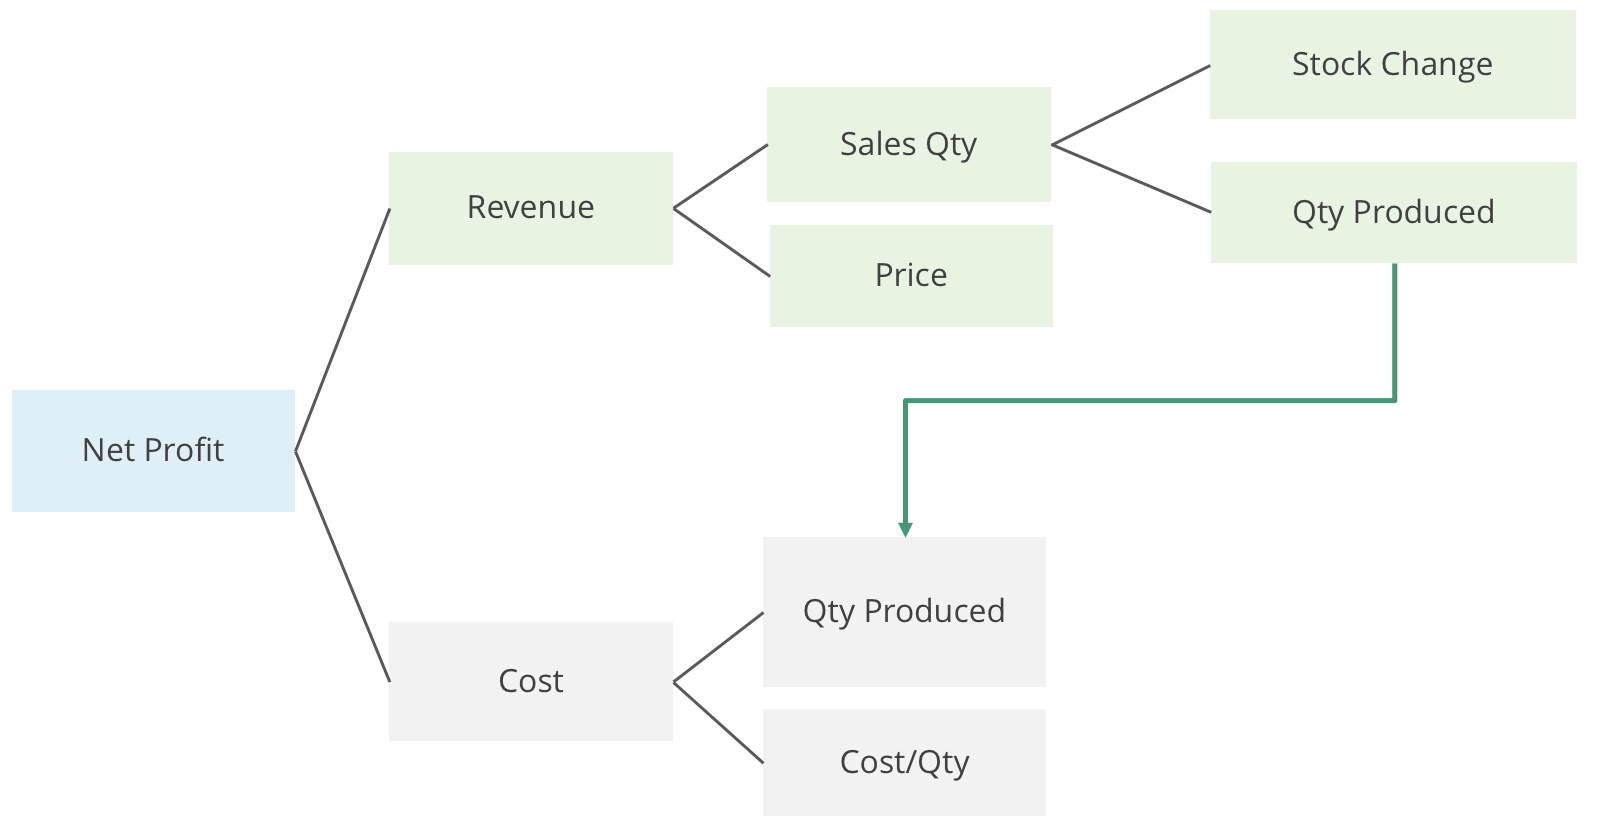
Once you understand the mathematical relationship between these drivers and KPIs, it is possible to understand how variations in one or more drivers can impact the overall outcome.
It’s a network, not a tree
Interestingly, the value driver tree is not strictly a tree but a network. In the example visual from above, ‘Quantity Produced’ impacts not only the revenue but also the costs. In essence, we are working with a set of parameters that are not isolated, but interconnected. The beauty of value driver tree lies in the fact that it captures the impact due to simultaneous changes to multiple drivers that are interlinked.
* * *
A Value Driver Tree in Action
A representative value driver tree is shown in the animation below. Note how contemporary innovations in technology & visualization enable instantaneous updates to the outcome (Gross profit) whenever the drivers are changed.
The animated demo shown above has been generated using Lumel’s ValQ.
ValQ is Lumel’s no-code business planning solution. ValQ is very intuitive, interactive and supports instant strategic decision making. It empowers you to model any business scenario in minutes, build complex business plans, what-if simulations, create & compare budgets, forecasts, and scenarios – all within Microsoft Power BI. Try ValQ for free here.
Do you know the Key Value Drivers in your company?
In subsequent blogs, we’ll review more topics of interest such as tips on getting the most out of value driver trees, best practices, how-to recommendations, software evaluation considerations, exciting features of ValQ and more.
To learn more, tune into one of our ValQ Webinars or try our product for free here.


