
Organizations use KPI at multiple levels to evaluate their success at reaching targets. The KPIs that are built as nodes in ValQ have conditional formatting (colour code) that helps you to be connected to your business’s heartbeat.
In this blog, let’s have a look at how we can customize conditional formatting for nodes based on the latest features in ValQ.
Setting Up Conditional Formatting
1. We’re going to use the sample dataset available here for demonstration. Note that we have sales budget and sales forecast data for Apr 2019 through Mar 2020 for combinations of Region, Category and Sales Rep.

- Import the dataset into Microsoft Power BI.
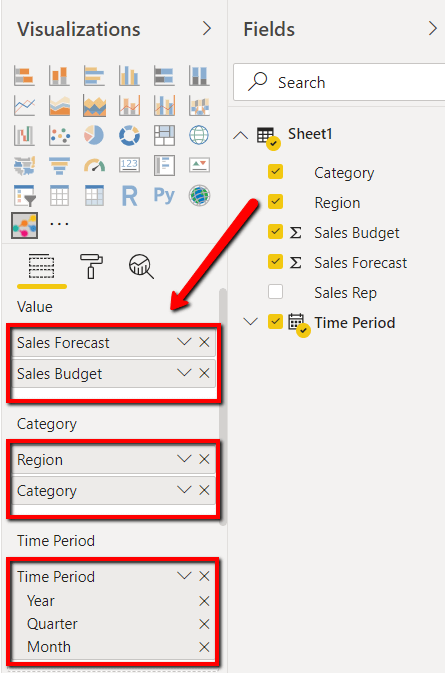
- Activate ValQ and create a simple dynamic tree model. Assign the properties to Value, Category and Time Period fields as shown.
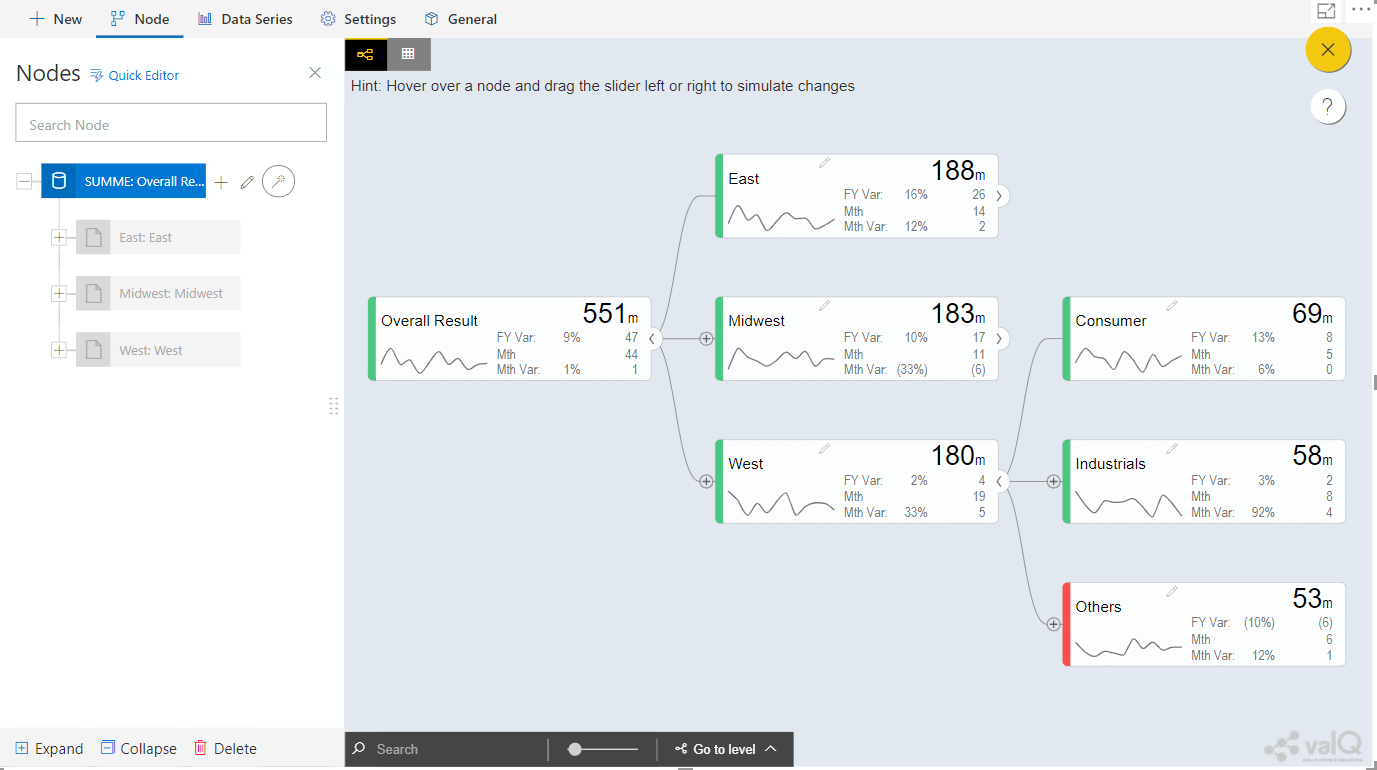
4. The visual would reflect as shown below. Note the conditional formatting appearing by default for every node in canvas.
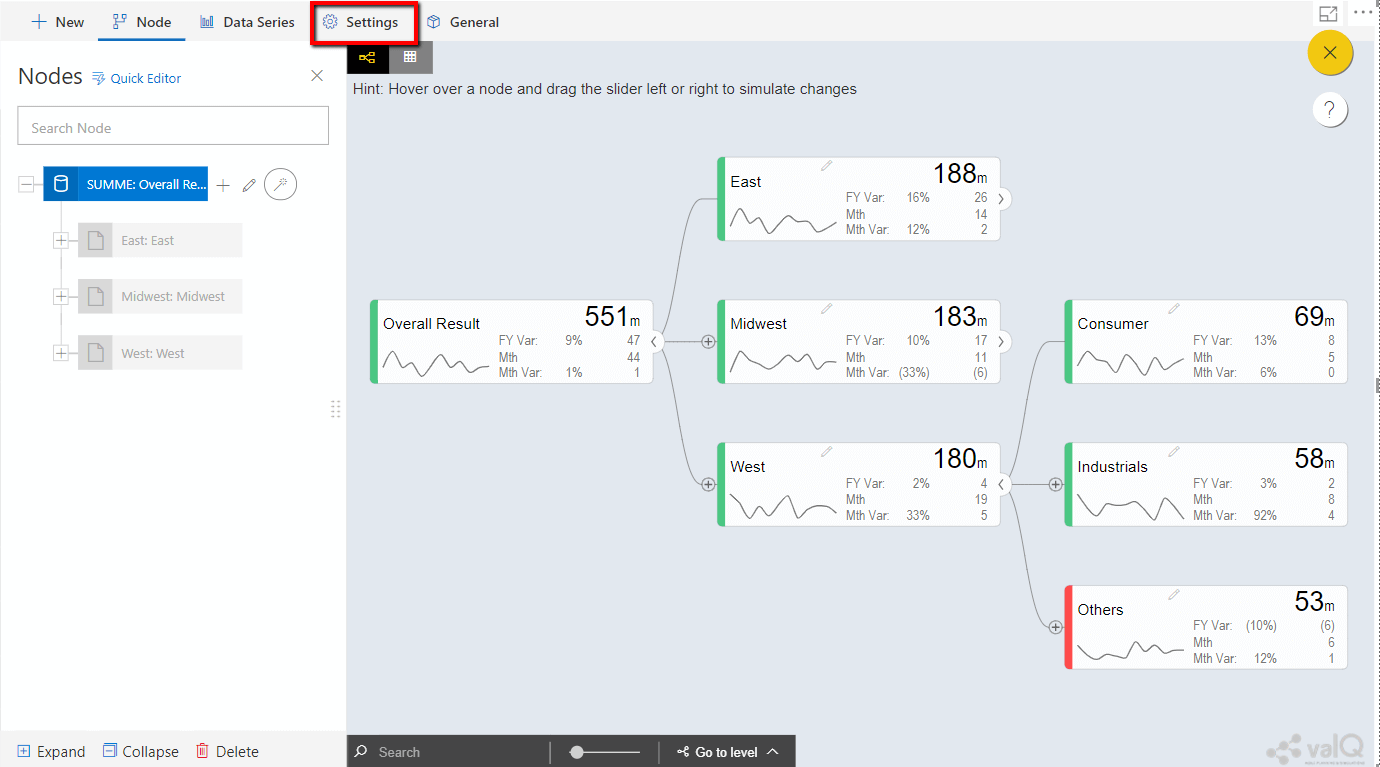
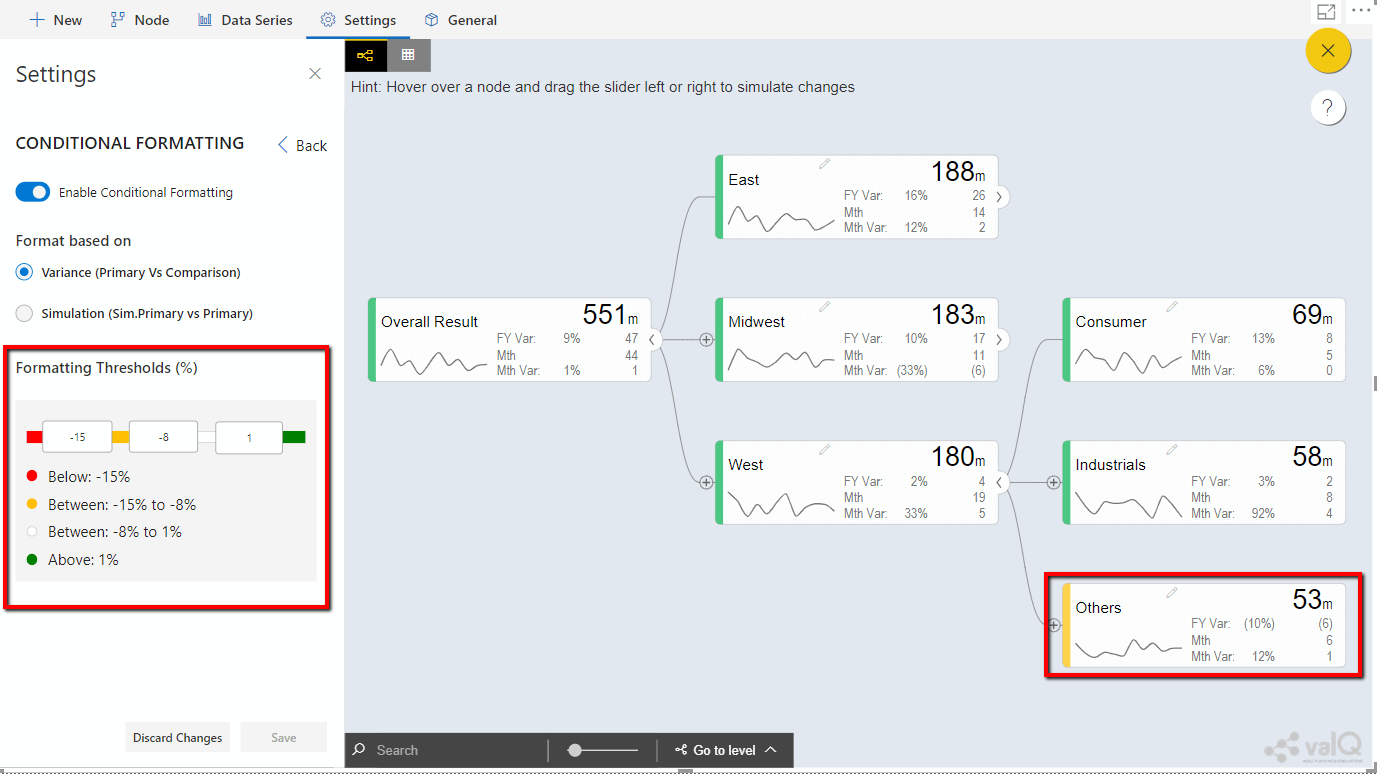
5. To see the default setting for conditional formatting applied to the nodes, navigate to Settings.
6. Click on Conditional Formatting as shown below:

7. You will see three options in this view.
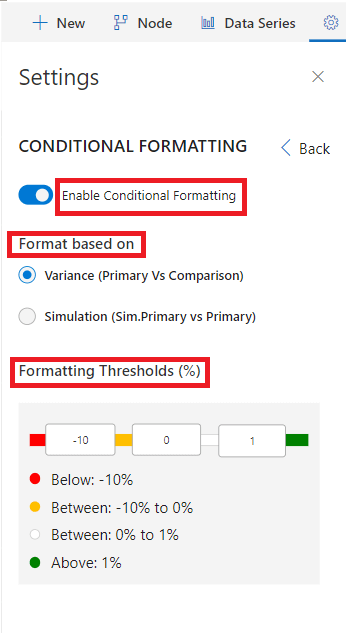
- ‘Enable Conditional Formatting’ allows you to turn on/off conditional formatting for the entire model
- ‘Format based on’ – has two options – Variance and Simulation
- Variance – applies formatting rules to primary vs. comparison series
- Simulation – applies formatting rules to simulated primary vs. primary series
- Formatting Thresholds (%) – shows the threshold inputs followed by the interpretation at the bottom.
8. Now let us change & save the values as shown below, and you will note that the ‘Others’ node changes from red to amber.
9. If you would rather compare simulated forecast vs. the forecast, you may choose the second option “Simulation Impact”. The result after the simulation would be as shown below – note that the un-simulated nodes do not have any conditional formatting set.
10. You may toggle ‘Enable Conditional Formatting’ for enabling or disabling conditional formatting as shown below:
Overriding Conditional Formatting at node level
Steps mentioned so far is for applying the conditional formatting setting to the nodes in your visual. However, if you want to customise this setting for a specific node, follow the below steps.
11. Since we created a simple model, we will have to convert it to an advanced model before we can change properties such as conditional formatting at the node level.
12. Click on the wand icon at the node ‘Overall Result’ in ‘Nodes’ hierarchy as shown.
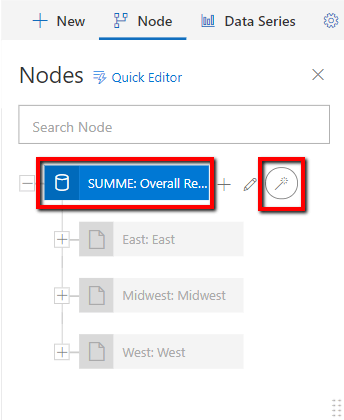
13. Click on ‘Yes’ to confirm the conversion to advanced model.
14. You will notice the nodes reflecting in ‘Nodes’ hierarchy are now activated.
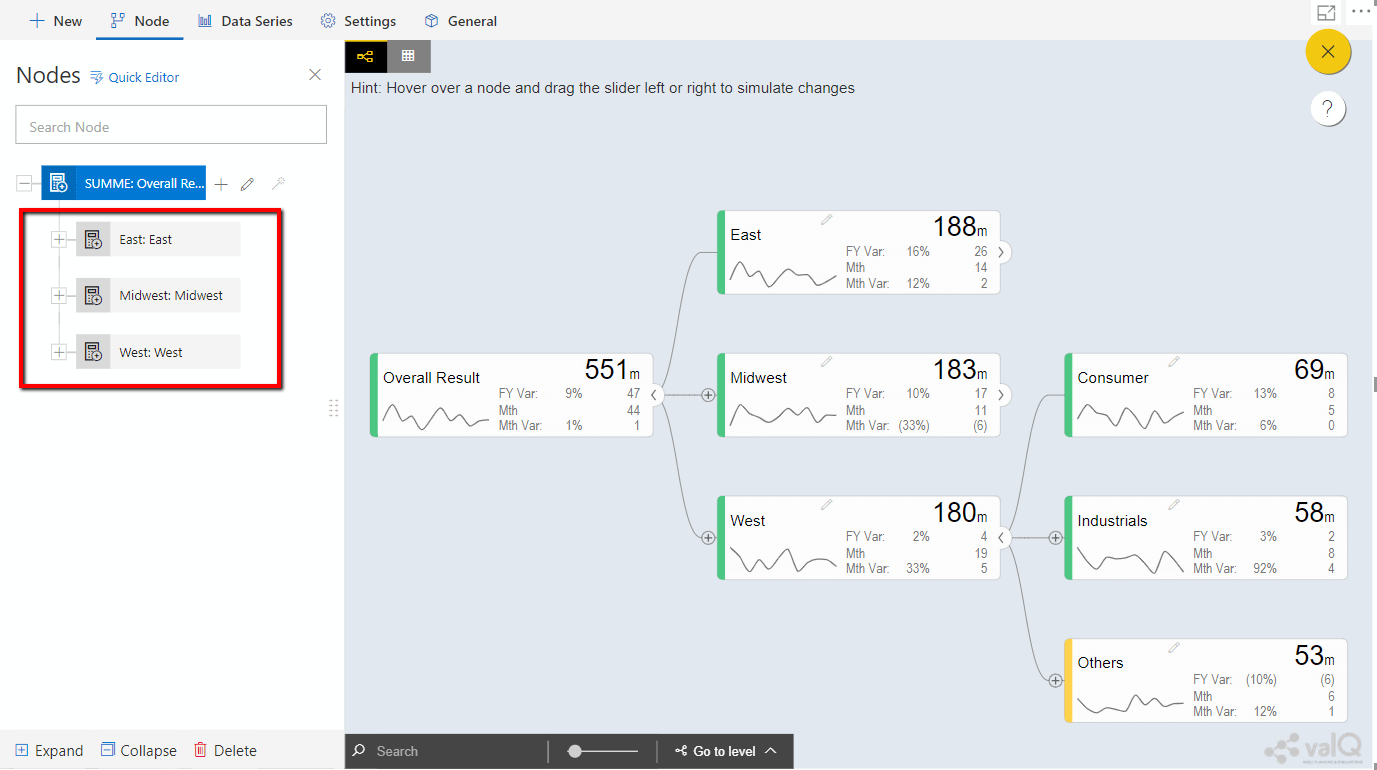
15. Double click on the node, ‘East’, or click on the pencil icon next to the node, ‘East’, to configure the nodes.
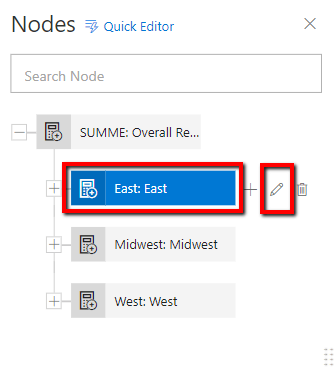
16. Click on ‘Conditional Formatting’ as ‘Edit Node’ screen pops up.
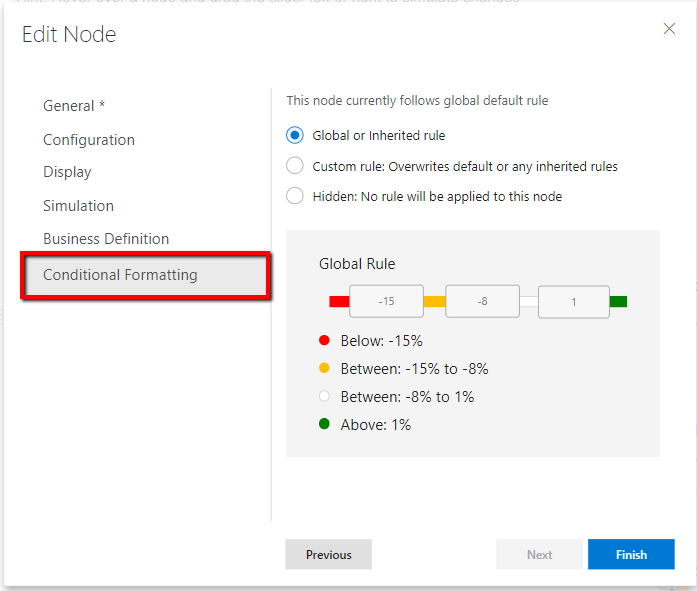
17. You will see that this node follows the ‘Global or Inherited rule’. To change this default setting click on ‘Custom rule: Overwrites default or any inherited rules’ where you will be given an option to go for either ‘Percentage’ or ‘Value (Applied at period level)’ as shown. Note that it would be set to ‘Percentage’ by default with an option to apply to descendants of that node.

18. Nodes will now start reflecting in canvas as per the customised setting as shown below:
19. Similarly, you can apply conditional formatting in value at period level.
20. Furthermore, you can go for ‘Hidden: No rule will be applied to this node’ if you don’t want to use the conditional formatting feature for that node.
With this, you have successfully learned how to configure conditional formatting feature in ValQ.
To learn more, tune into one of our ValQ Webinars or try our product for free here.


