
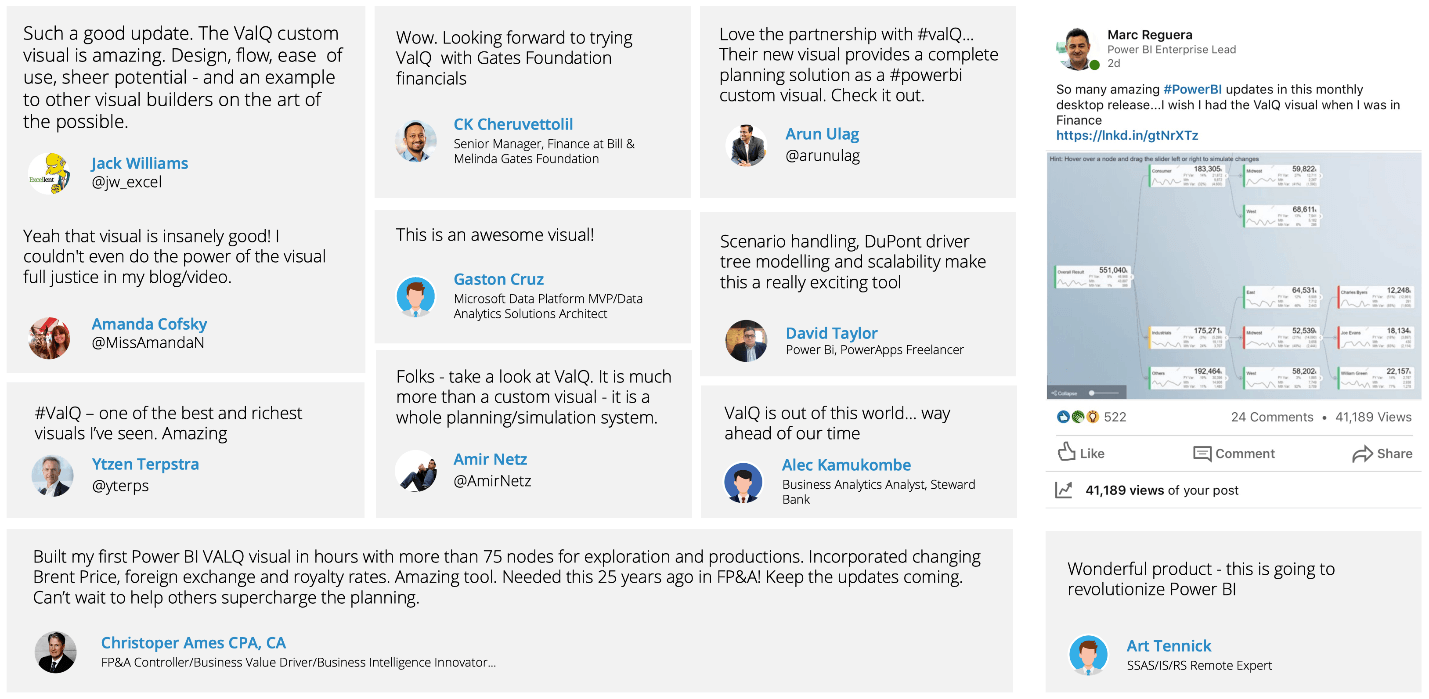
On May 17th Friday afternoon, Visual BI’s ValQ for modern visual planning was introduced to the world through Microsoft’s May 2019 Power BI Desktop summary blog. This made the week a blockbuster for ValQ (With 1,000+ product downloads and 100K+ views) and the Power BI user community (as per their strong positive feedback and excitement in social media).
Given this context, I am happy to document and share highlights of our partnership experience with Microsoft. Specifically, I would like to mention how great the Microsoft Power BI team has been in playing an instrumental role in supporting partners like Visual BI who are looking to quickly reach a wide spectrum of users worldwide.
Visual BI Entry into Microsoft Power BI Ecosystem
1. Started exploring the Microsoft Power BI visuals AppSource (Feb 2018): Visual BI has a strong track record in delivering visualization products that are being used by 200+ enterprise customers in the SAP ecosystem. We knew that Microsoft had a great product in Power BI. However, the AppSource for Power BI visuals were already very crowded, and we were wondering whether we were 2 years too late getting into the Power BI AppSource.
2. Achieving Gold Partner Status for Data Analytics (Feb – July 2018): So, we decided to first focus on growing our Microsoft BI & Analytics consulting services practice and achieved the Gold Status for BI & Analytics Partner in less than 6 months.
3. Release our Pilot Power BI Visual in Horizon Chart (Sep 2018): The Microsoft Power BI visuals/platform SDK was new to us, and we decided to experiment with the Power BI visuals SDK framework by releasing the Horizon Chart as our first pilot visual. We also learnt a lot of do’s & don’ts in the process. The unexpected morale boost came when it got picked up by Amanda Cofsky (Senior Program Manager – Power BI) on her own and received coverage in the Sep 2018 feature summary blog.
Visual BI Leverages Microsoft Partnership
1. Introducing Visual BI to Microsoft Power BI leadership (Oct 2018): With this boost and the confidence arising out of our successful track record in building BI-centric products like Visual BI Extensions, VBI View and ValQ, I then approached Arun Ulag (GM – Power BI Engineering) to formally introduce Visual BI to his entire team and expressed our desire to bring our successful products into the Power BI ecosystem. He immediately recognized “ValQ” as the first one he would like to see inside Power BI and immediately connected me with Power BI visuals team in Israel.
2. Started working with Power BI Visuals Team in Israel (since Nov 2018): Our engineering team then closely worked with Ranin Salameh, Product Manager for Power BI Visuals team. Ranin drove weekly meetings with us, educated us on the Power BI visual SDK/Platform and connected us with other Power BI engineers to help us along the way. Moshe Golan (Engineering Manager – Power BI) and his technical team stepped in as well to help with technical suggestions and ideas. All of this guidance from the Power BI visuals team in Israel helped us architecturally get things right the first time.
3. ValQ Soft Launch at Gartner BI & Analytics Conference (Mar 2019): Visual BI then decided to unveil ValQ for the first time at 2019 Gartner BI & Analytics conference. I reached out Arun Ulag and Amir Netz (Technical Fellow – Microsoft BI) a week before the event and ended up demonstrating the product remotely to them on 2 separate days. Luckily, they think and act alike as both immediately saw ValQ’s potential and agreed to meet with me in person at the Gartner Conference. I met Amir in Orlando and we chatted at length about our vision and roadmap for ValQ. Most importantly, Amir shared his passion and desire to bring planning use cases into Power BI and he was as excited as I was. We agreed to have follow-up discussions in Bellevue to discuss ValQ roadmap in detail.
4. Power BI-monthly blog preparations with Amanda (April 2019): Before our Bellevue meeting, we were also introduced to Amanda Cofsky for her monthly Power BI desktop updates blog at the Gartner Conference by Amir. We had a couple of online sessions where we introduced the product, and we were excited to hear great feedback on her experience in building the required demos herself for the blog. She also had good feature suggestions that were immediately incorporated into ValQ.
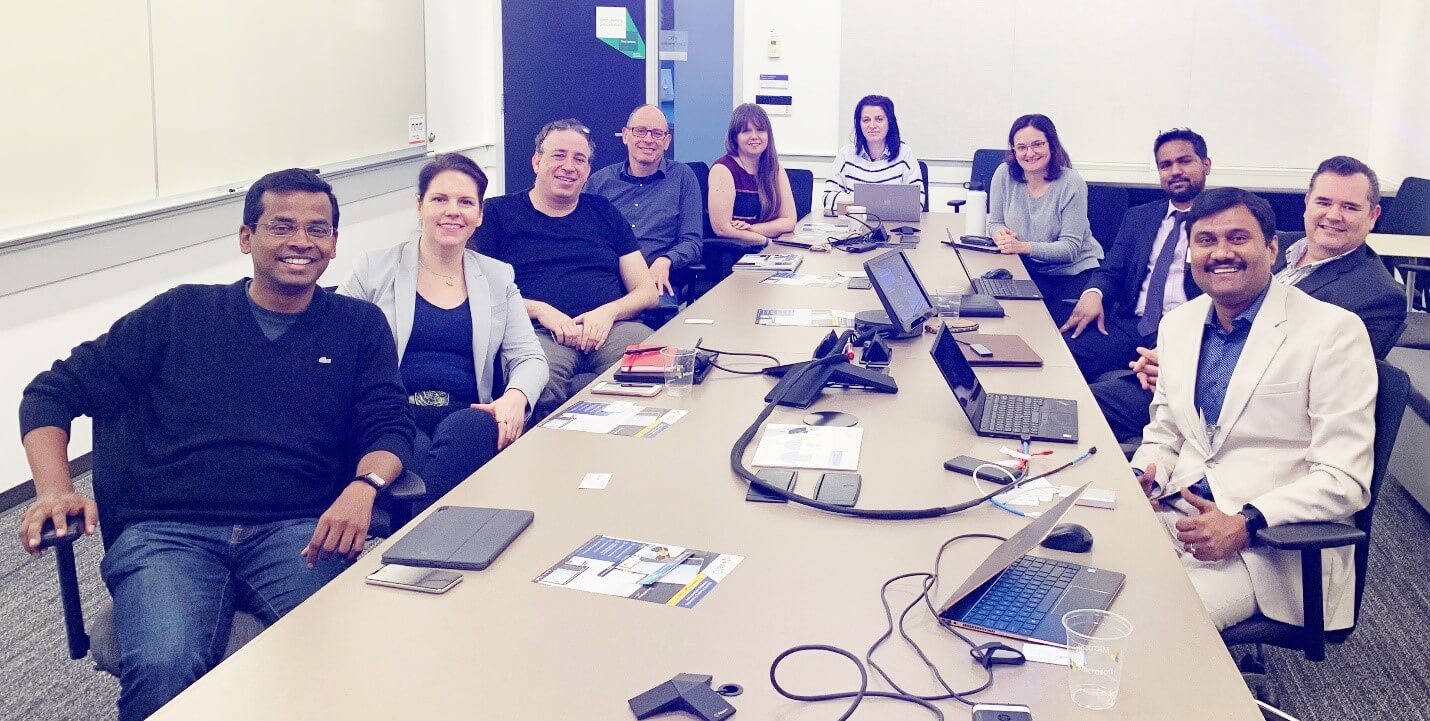
5.Roadmap and GTM Discussions at Bellevue, WA (April 2019): We were introduced to additional awesome folks at Microsoft HQ as we discussed ValQ roadmap and how best to provide seamless user experience for Power BI customers. Here we met Ofer Ashkenzi (Senior Program Manager) who since started playing the role of partner mentor in guiding us with connecting several other folks inside Microsoft eco-system and in helping us explore additional Power BI offerings like Template Apps and Power BI embedded offerings for ValQ.
We would also like to thank Eyal Carmel, Aviv Ezrachi, Nico Cristache, Kim Manis, Cory Hrncirik, Mark Reguera, Tamer Farag, Auste Viesulas and Nina Wildes for their support in this Journey.
6. Watch ValQ Live at Microsoft Business Application Summit in Atlanta: You can join me and Ranin at Microsoft Business Application Summit in Atlanta (June 11 – 12 2019) to hear this partnership success story and live ValQ demo in our session (BRK 2076) – Microsoft Power BI: Deliver a powerful data story with Power BI visuals.

What’s next for ValQ?
1. As they say “Imitation is the sincerest form of flattery” – just like Microsoft Power BI, ValQ will have very agile monthly releases as we look to quickly scale ValQ for all customer segments
2. ValQ community-driven ideas and support forum (coming soon at valq.com )
3. Power BI embedded as a service offering with extended enterprise capabilities like sharing scenarios and models, collaborating concurrently with multiple users and alternative consumption-based pricing models
4. ValQ Power BI template Apps with pre-defined data models for major SMB ERPs like Dynamics F&O, Quick Books, Xero, Net Suite
5. Popularizing ValQ for Modern Visual Planning exercises in educational institutions
6. … and more
Concluding Thoughts & Thank You
This blog wouldn’t be complete if I don’t summarize my high-level thoughts on our overall experience.
1. The Microsoft Power BI team genuinely treats their partners like customers and give the greatest gift someone can give i.e., “Time”. Without their involvement & guidance, we probably would have taken a lot longer to come to this stage.
2. Microsoft teams & individuals encapsulated great humility, teamwork, leadership and diversity. For Visual BI, we had incredible culture lessons and partnership experience with the Power BI team. It makes me wonder if this is just one great team inside the giant Microsoft or just the culture that Microsoft has managed to nurture over the years.
p.s. Ever since I watched Amir Netz present “DELIVER AI FOR EVERYONE WITH POWER BI” Session at the 2019 Gartner BI & Analytics Conference, I have been dreaming of co-presenting “Delivering Modern Digital Planning for Everyone with Power BI” with Amir in 2020 @ Gartner Conference. Don’t you all want to see something new by then?
To learn more, tune into one of our ValQ Webinars or try our product for free here.


