How to pin your favorite visual in Power BI in 3 Steps?

ValQ
June 26, 2019

Microsoft released a cool new feature as part of its June 2019 release – the ability to pin your favorite custom visual.

Until now, you had to import a custom visual into Power BI file every time you build a new report using the same custom visual. In other words, custom visuals you import were only part of the specific report you built – and were not a permanent fixture in the visualization pane.

This new feature exactly addresses that and helps users install-once-and-deploy-many times.

As of June 2019, this is a preview feature available in the Power BI Desktop. Here is how you can use it:

1. Turn-on the preview feature in your account

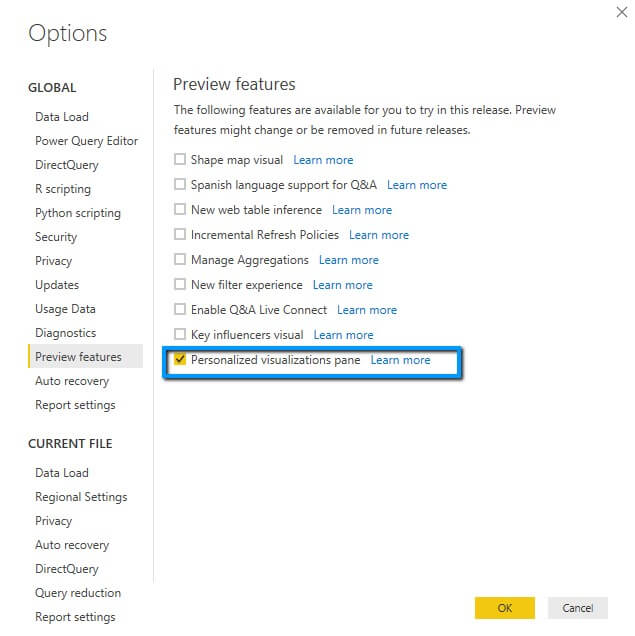
You can switch it on by flowing through File -> Options and settings -> Options -> Global -> Preview features and checking the ‘Personalized visualizations pane’

2. Import the ValQ custom visual

As soon as you have imported the visual, you will be able to see it under a dashed line.

3. Pin ValQ to the Visualizations pane

Right click on the ValQ icon to select ‘Pin to visualizations pane’ – It will now show up alongside other standard Power BI visuals.
Any new reports you build will automatically have the ValQ visual included.

To learn more, tune into one of our ValQ Webinars or try our product for free here.

Get ValQ brochure

Discover the incredible power of dynamic and collaborative business planning with ValQ
Download now

Visualize and analyze business outcomes with ease

Discover how ValQ delivers agile, interactive and intuitive business planning.
Request a Demo

Get ValQ brochure

Discover the incredible power of dynamic and collaborative business planning with ValQ
Download now

Visualize and analyze business outcomes with ease

Discover how ValQ delivers agile, interactive and intuitive business planning.
Request a Demo
ValQ
About ValQ!
ValQ empowers analysts, executives and decision-makers across departments and functions. Model any business scenario in minutes, build complex business plans, what-if simulations, create & compare budgets, forecasts and scenarios – all within Microsoft Power BI. The product is developed by Lumel Technologies (formerly Visual BI), which has a decade of experience in building add-on solutions on top of BI platforms (SAP BI and Power BI) with our suite of innovative products such as xViz and Inforiver.

Headquarters

5920 Windhaven Pkwy, #130
Plano TX 75093
Inforiver
xViz
cross linkedin facebook pinterest youtube rss twitter instagram facebook-blank rss-blank linkedin-blank pinterest youtube twitter instagram