
We are proud to announce that ValQ has now optimized touch support for Touch TV, mobile, and other touch-screen devices.
With touch navigation becoming increasingly prevalent in applications, ValQ has made this new update thereby enabling interactions with models easier and delightful for the end-users giving a digital board room experience.
ValQ will automatically detect the touch device and enable the touch features. You can also enable/disable the touch support functionality and switch back to general ValQ features.
In this blog we will look into the various feature enhancements that ValQ touch support offers :
ValQ features optimized for Touch Support
ValQ visual screen has unique touch features both in the Canvas (table/tree views) on the right and in the Navigation Panel on the left.
Navigation Panel
The Scenarios section is expanded by default, while all other components are collapsed. The Compare Scenarios features is now a button.
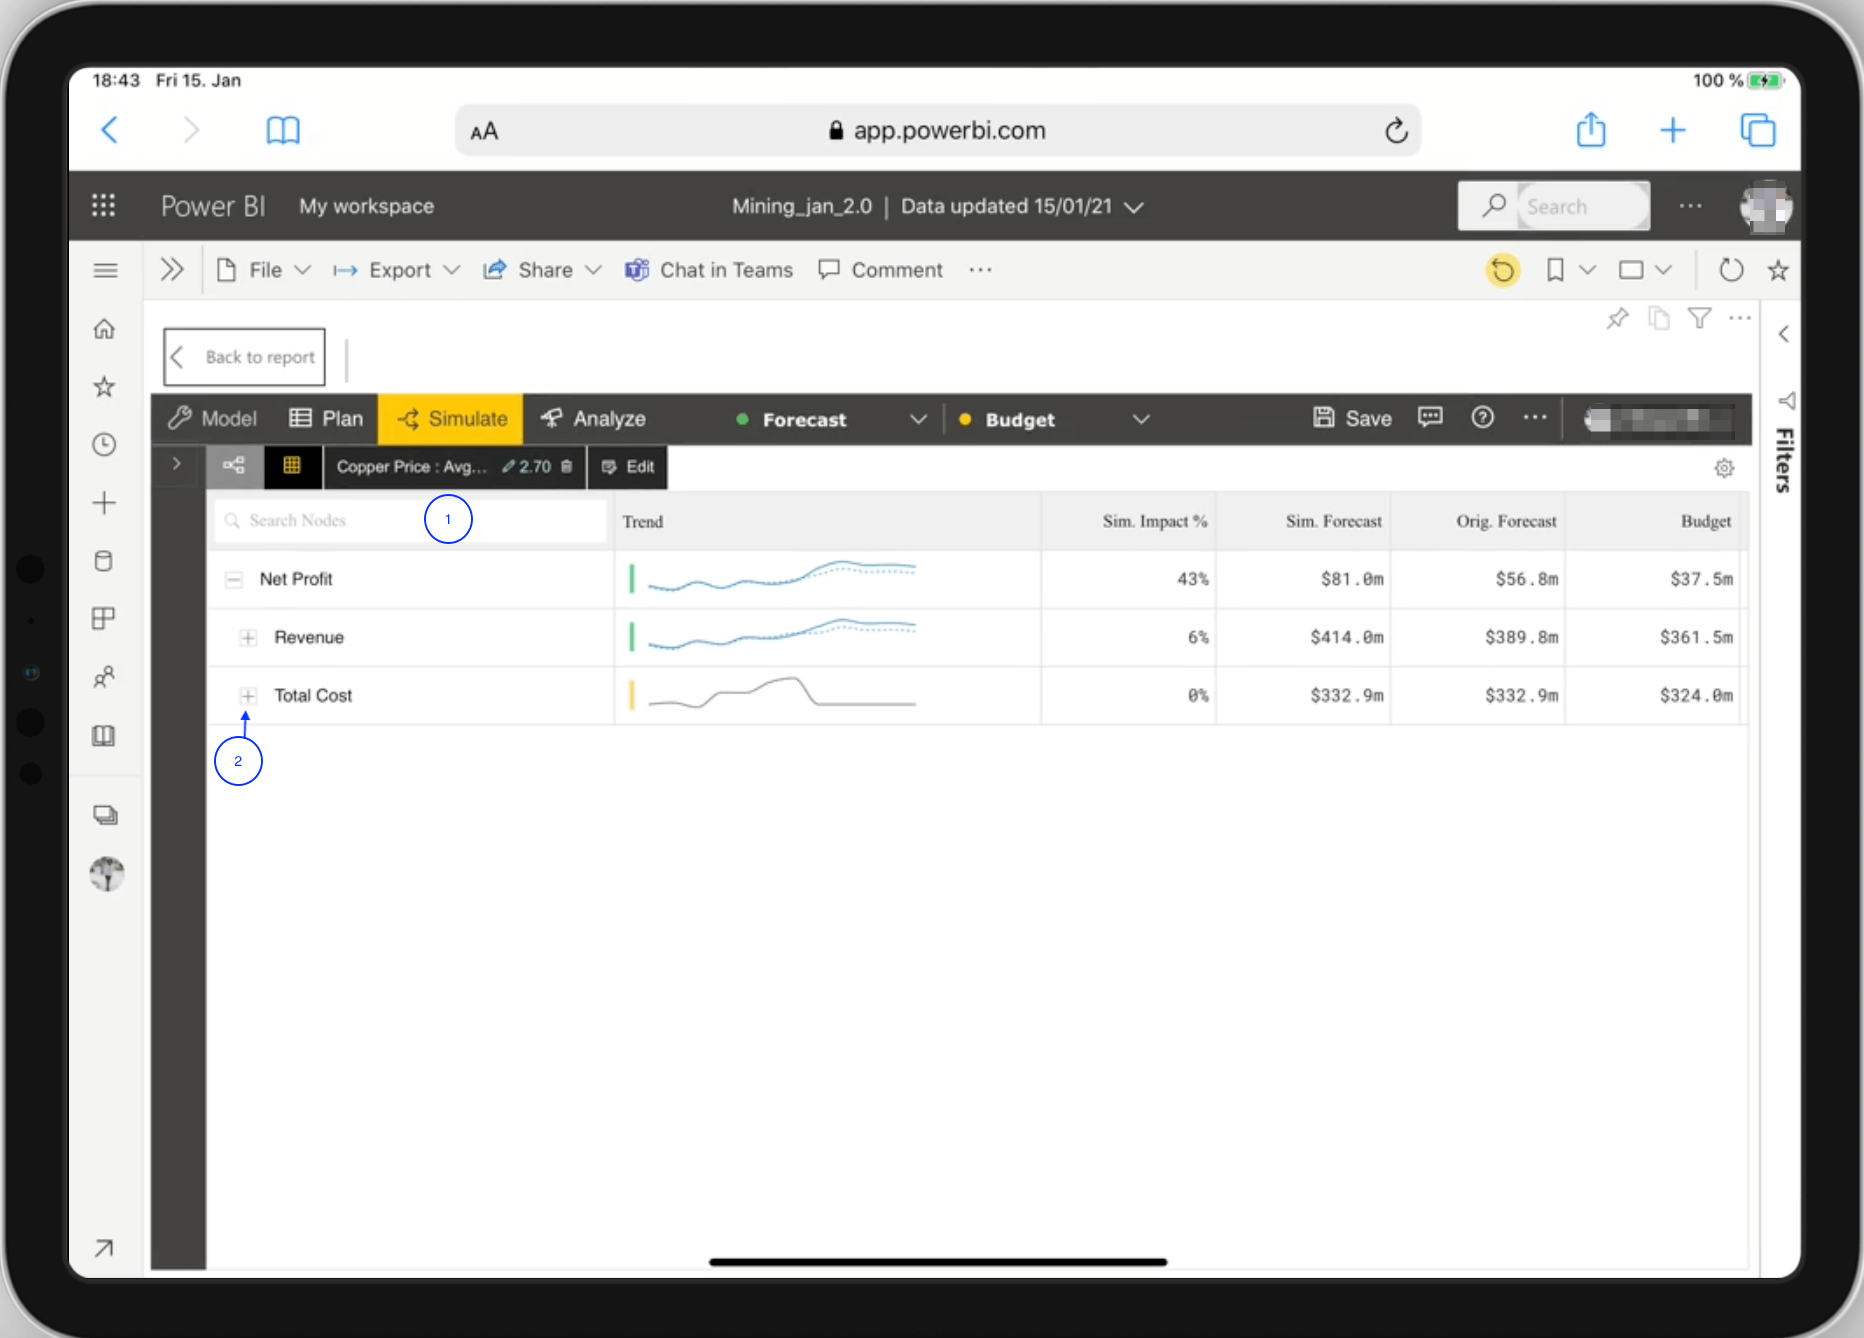
Table/Tree view
The visual has a Pinch and Zoom feature for easier accessibility. The ValQ model is visualized both in the table view and tree view.
ValQ visual touch bar options Tree Vs Table view:
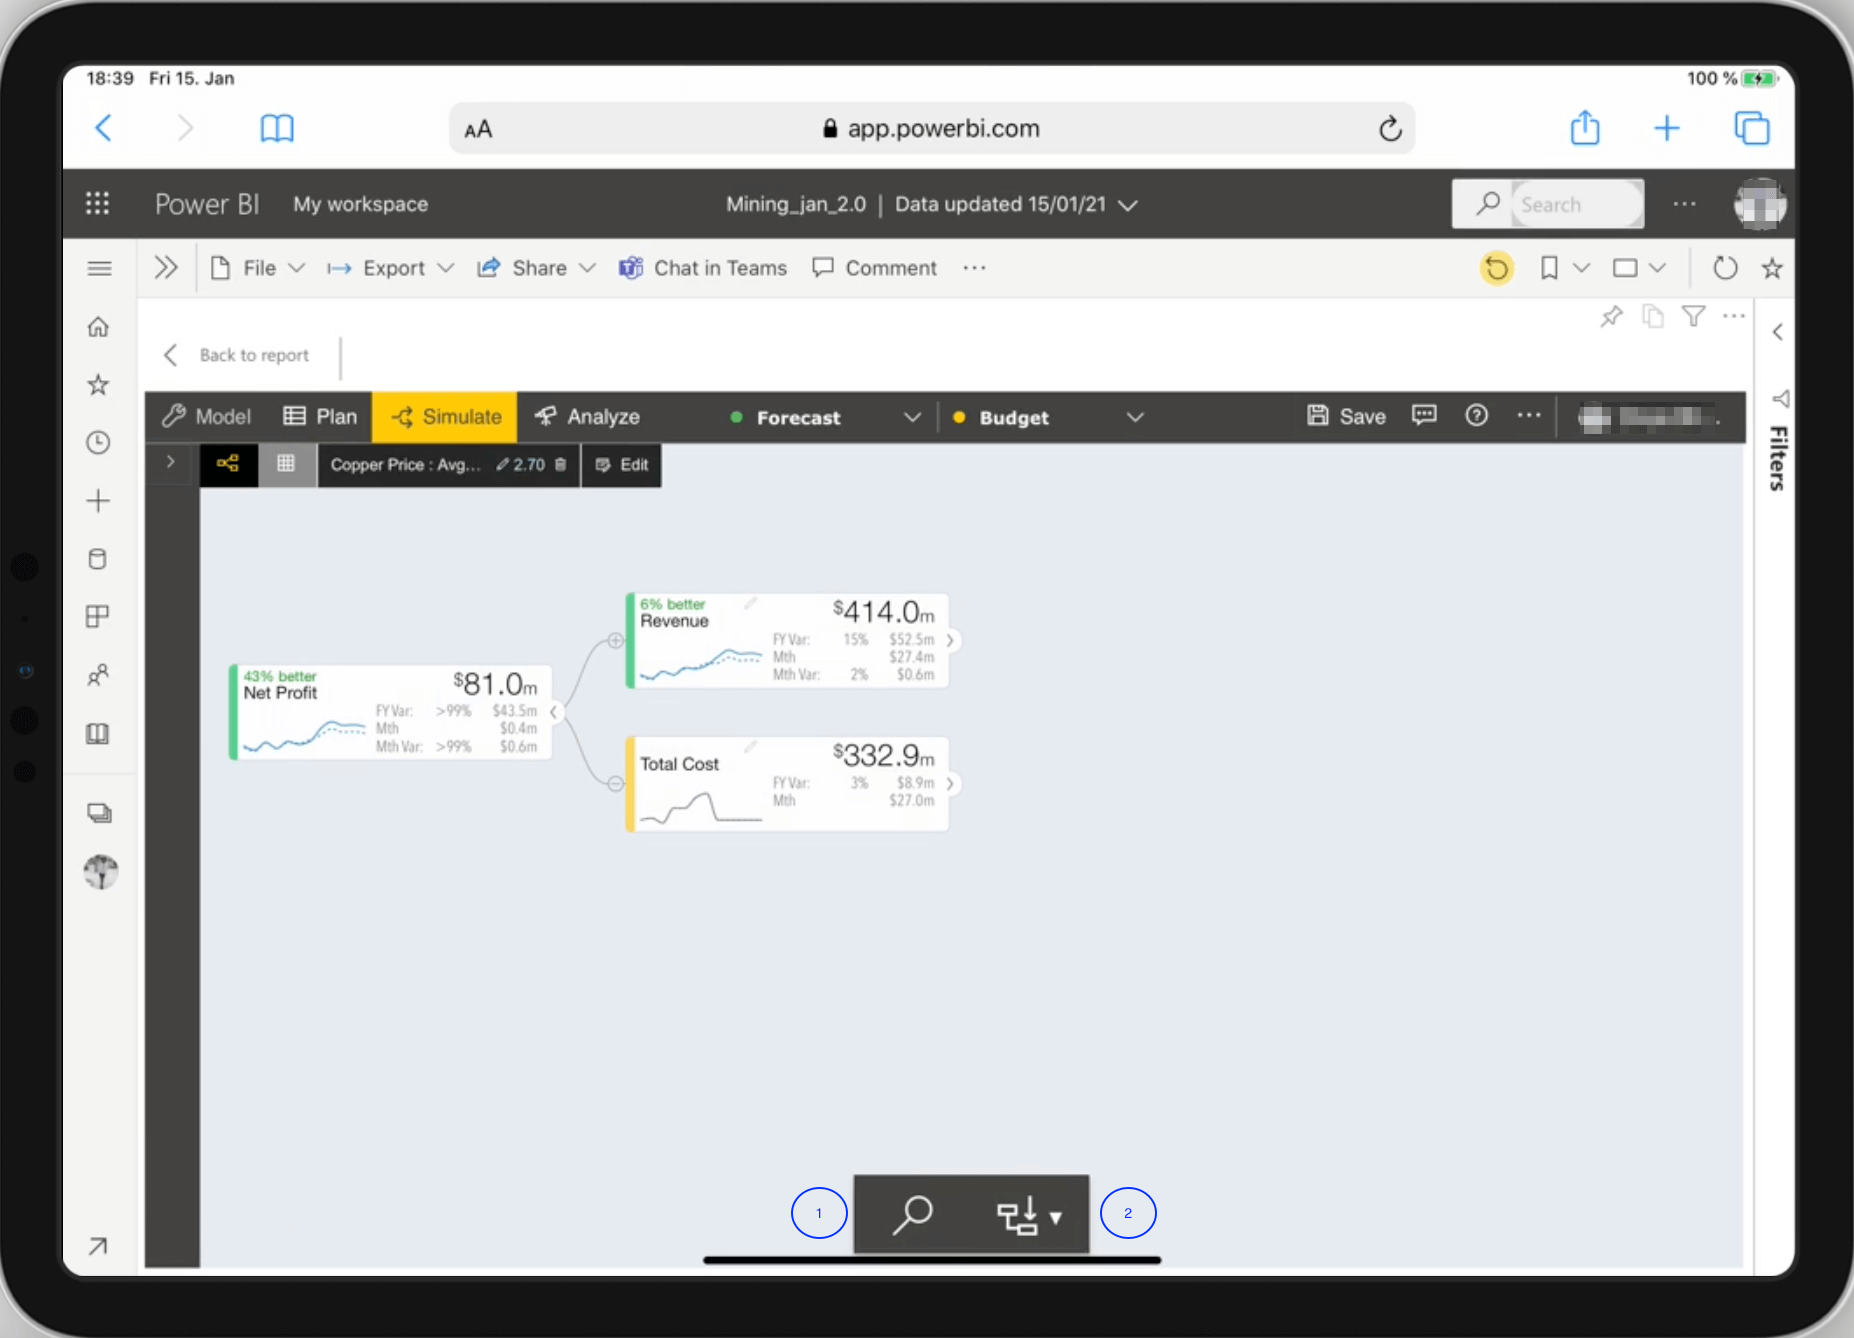
Default Canvas Tree view
Default Canvas Tree view
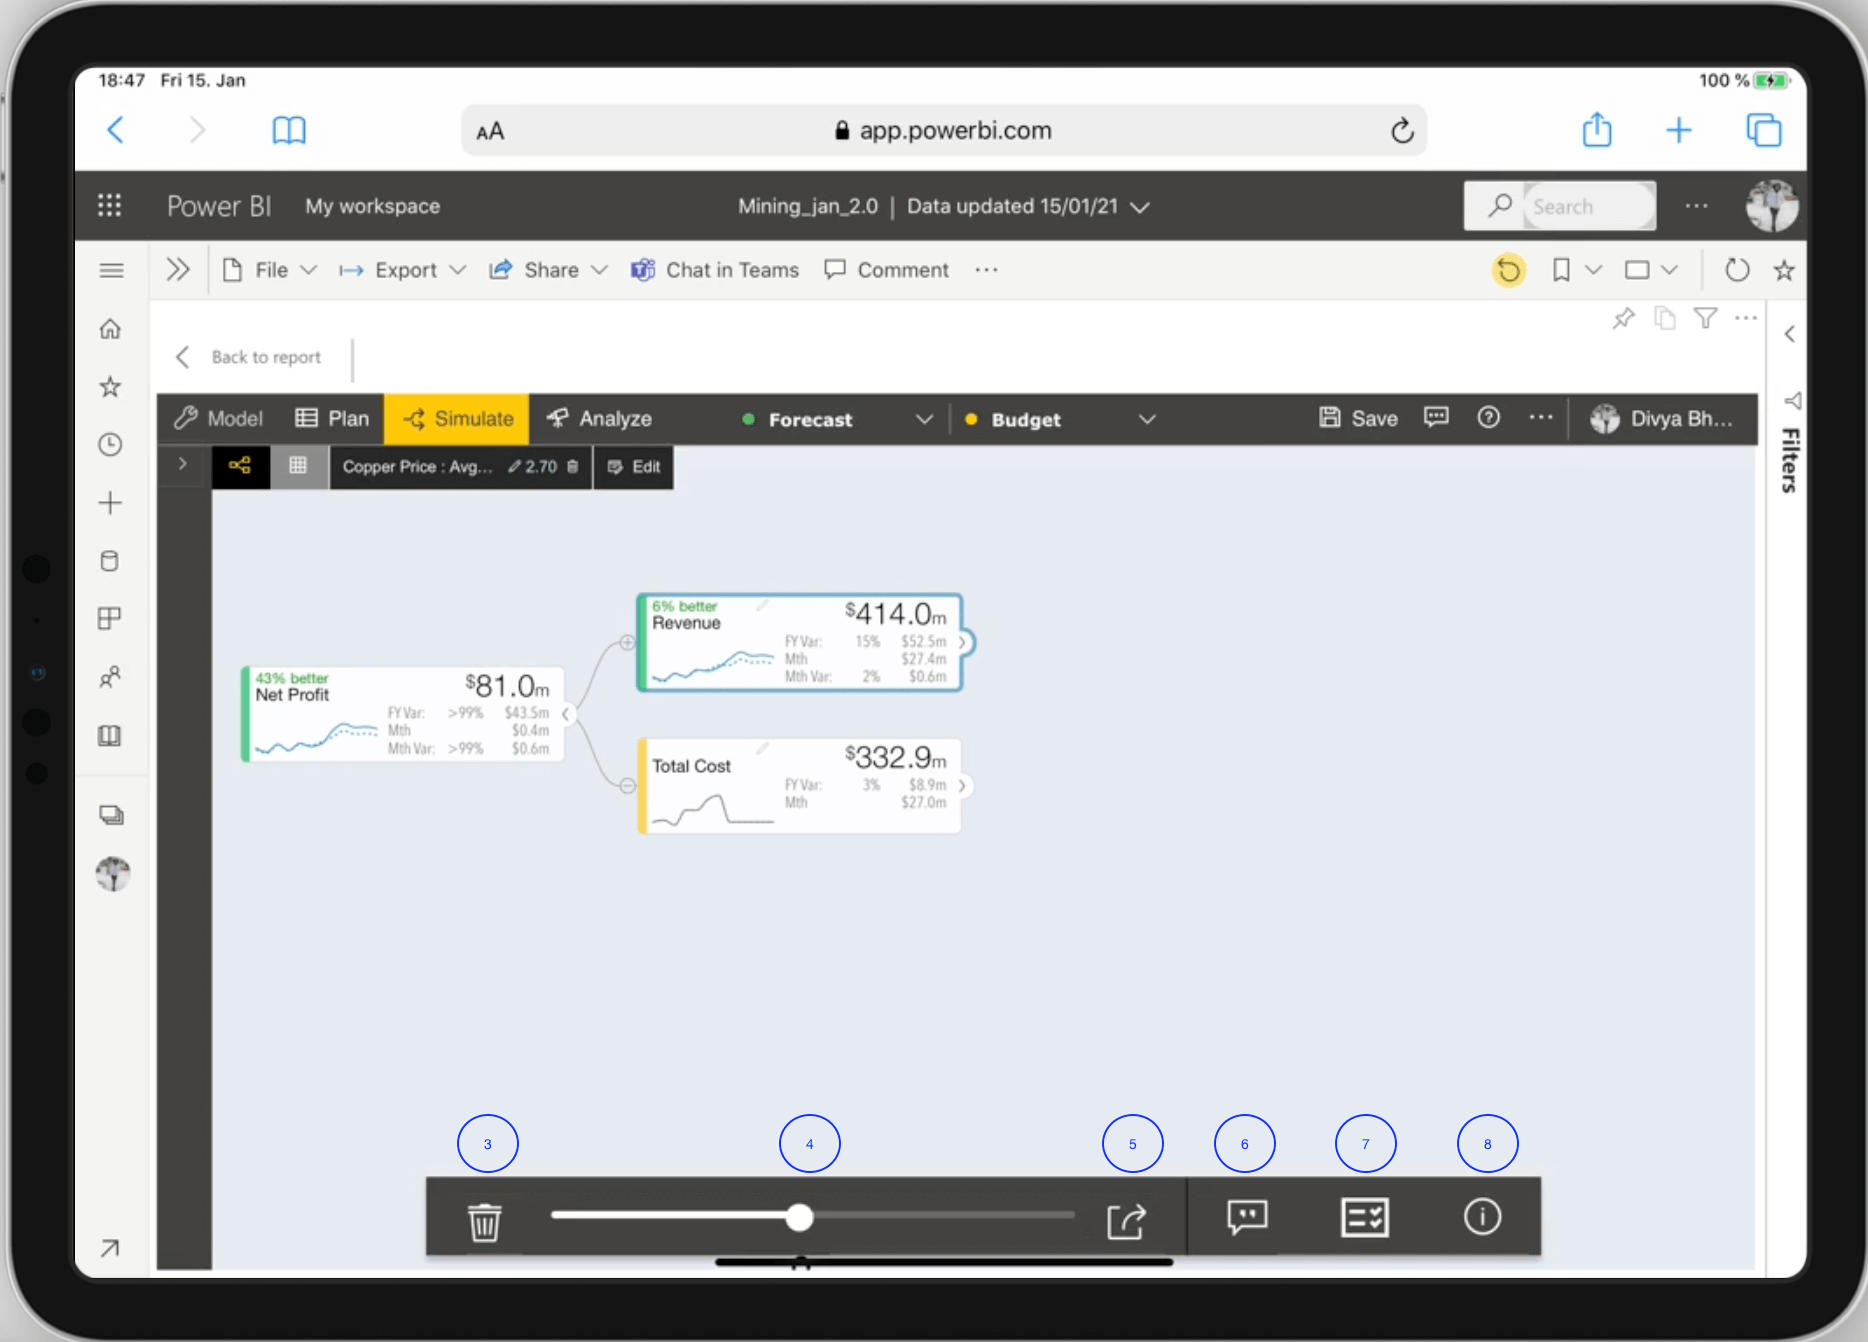
Node Touch Bar menu Tree view
- Search a node in the model.
- Go-to-level selection that displays the node hierarchy.
- Delete – Deletes the simulated value and restores the original value of the node
- Node Slider– Simulates a node.
- Month wise simulations
- Comments on the node from the users who share the model.
- Plan series– Shortcut icon to create Planning series.
Search
The Mac-style spotlight search allows you to search a node in the model. Tap on Search and start typing the node’s name:
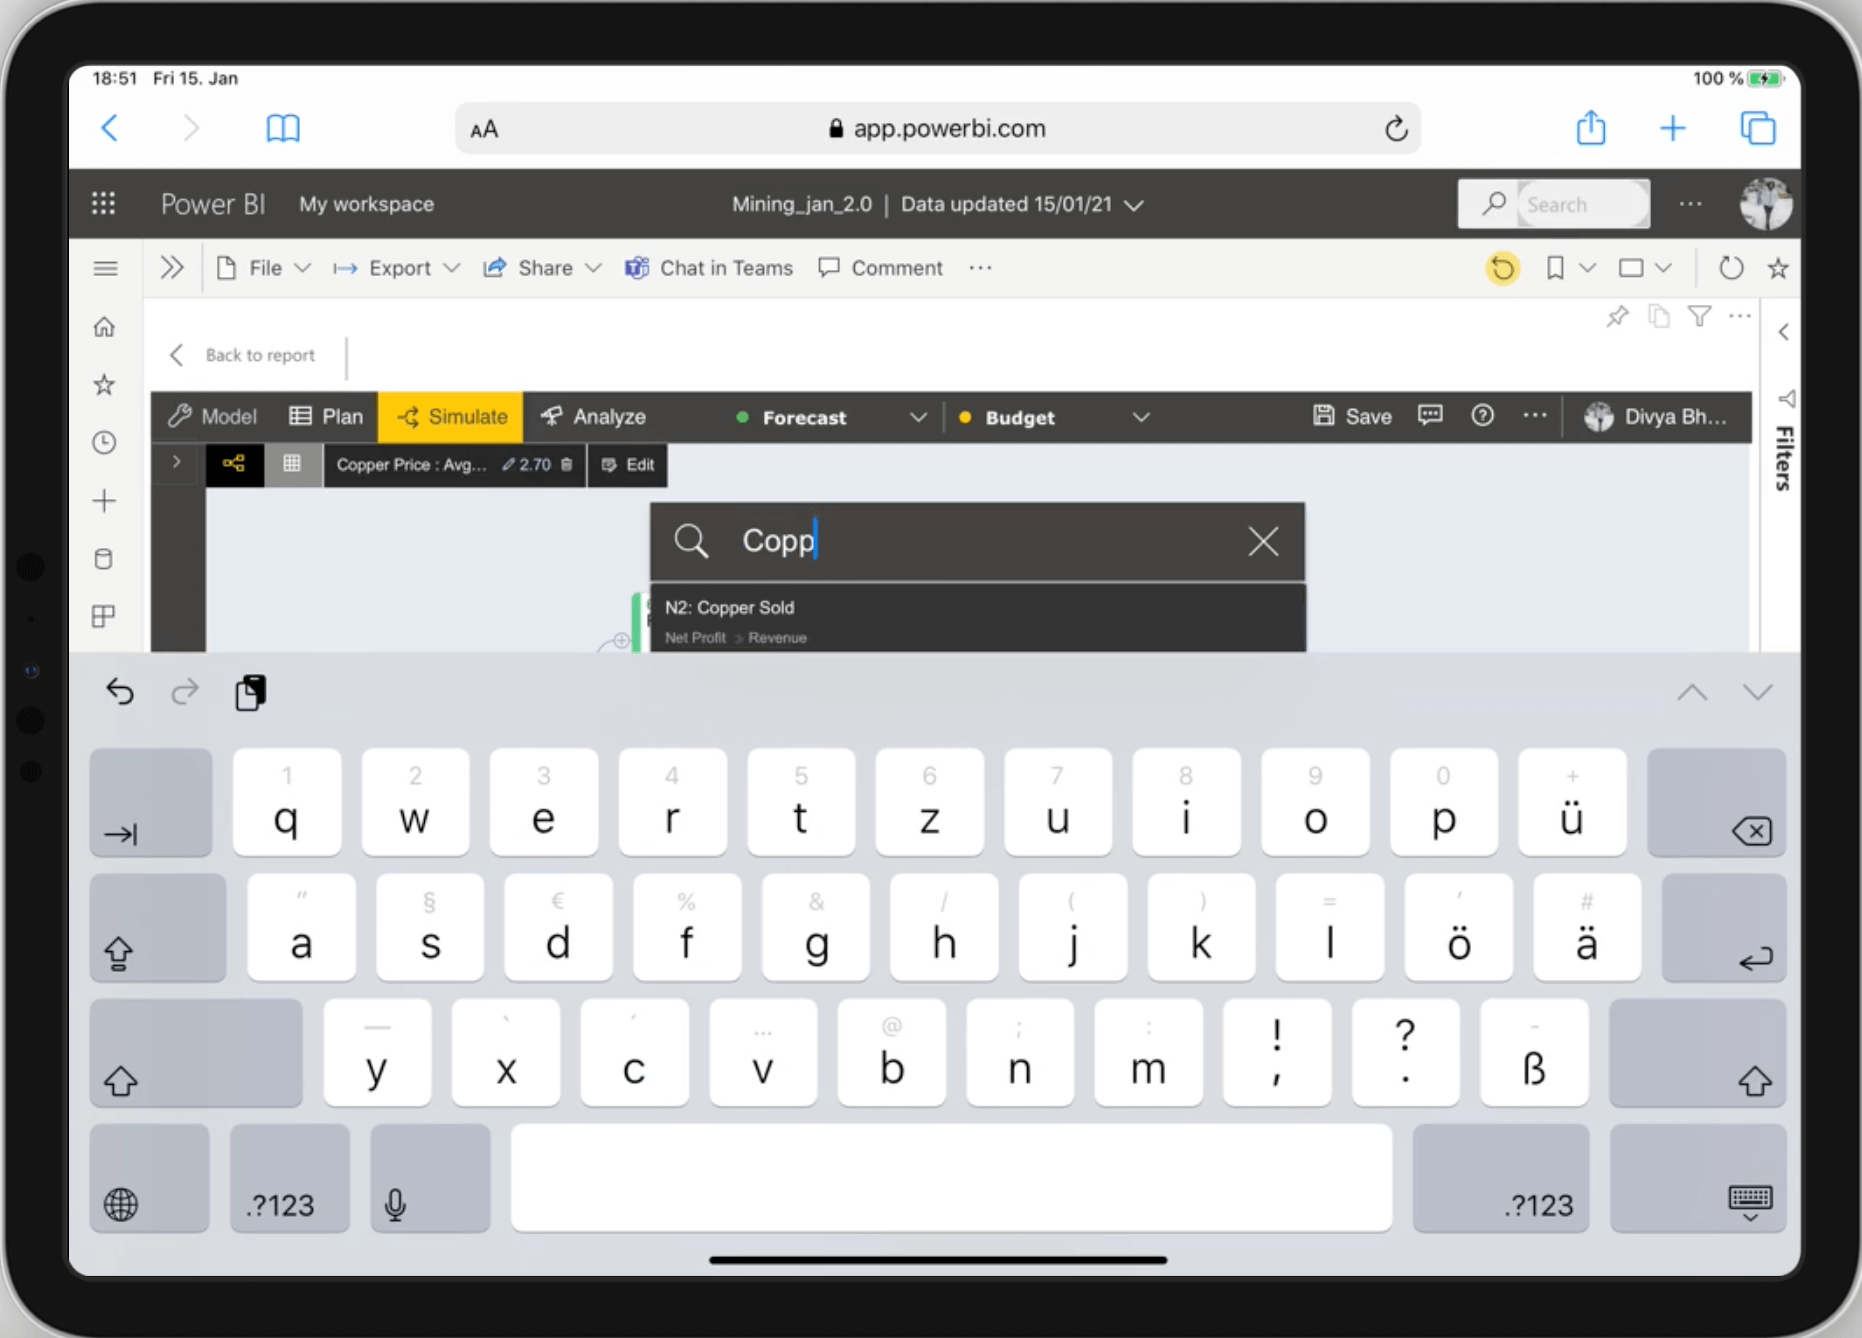
Type the name of the node in the search box
- In the Tree view, Copper Price node is selected and the model is expanded up to the selected node level.
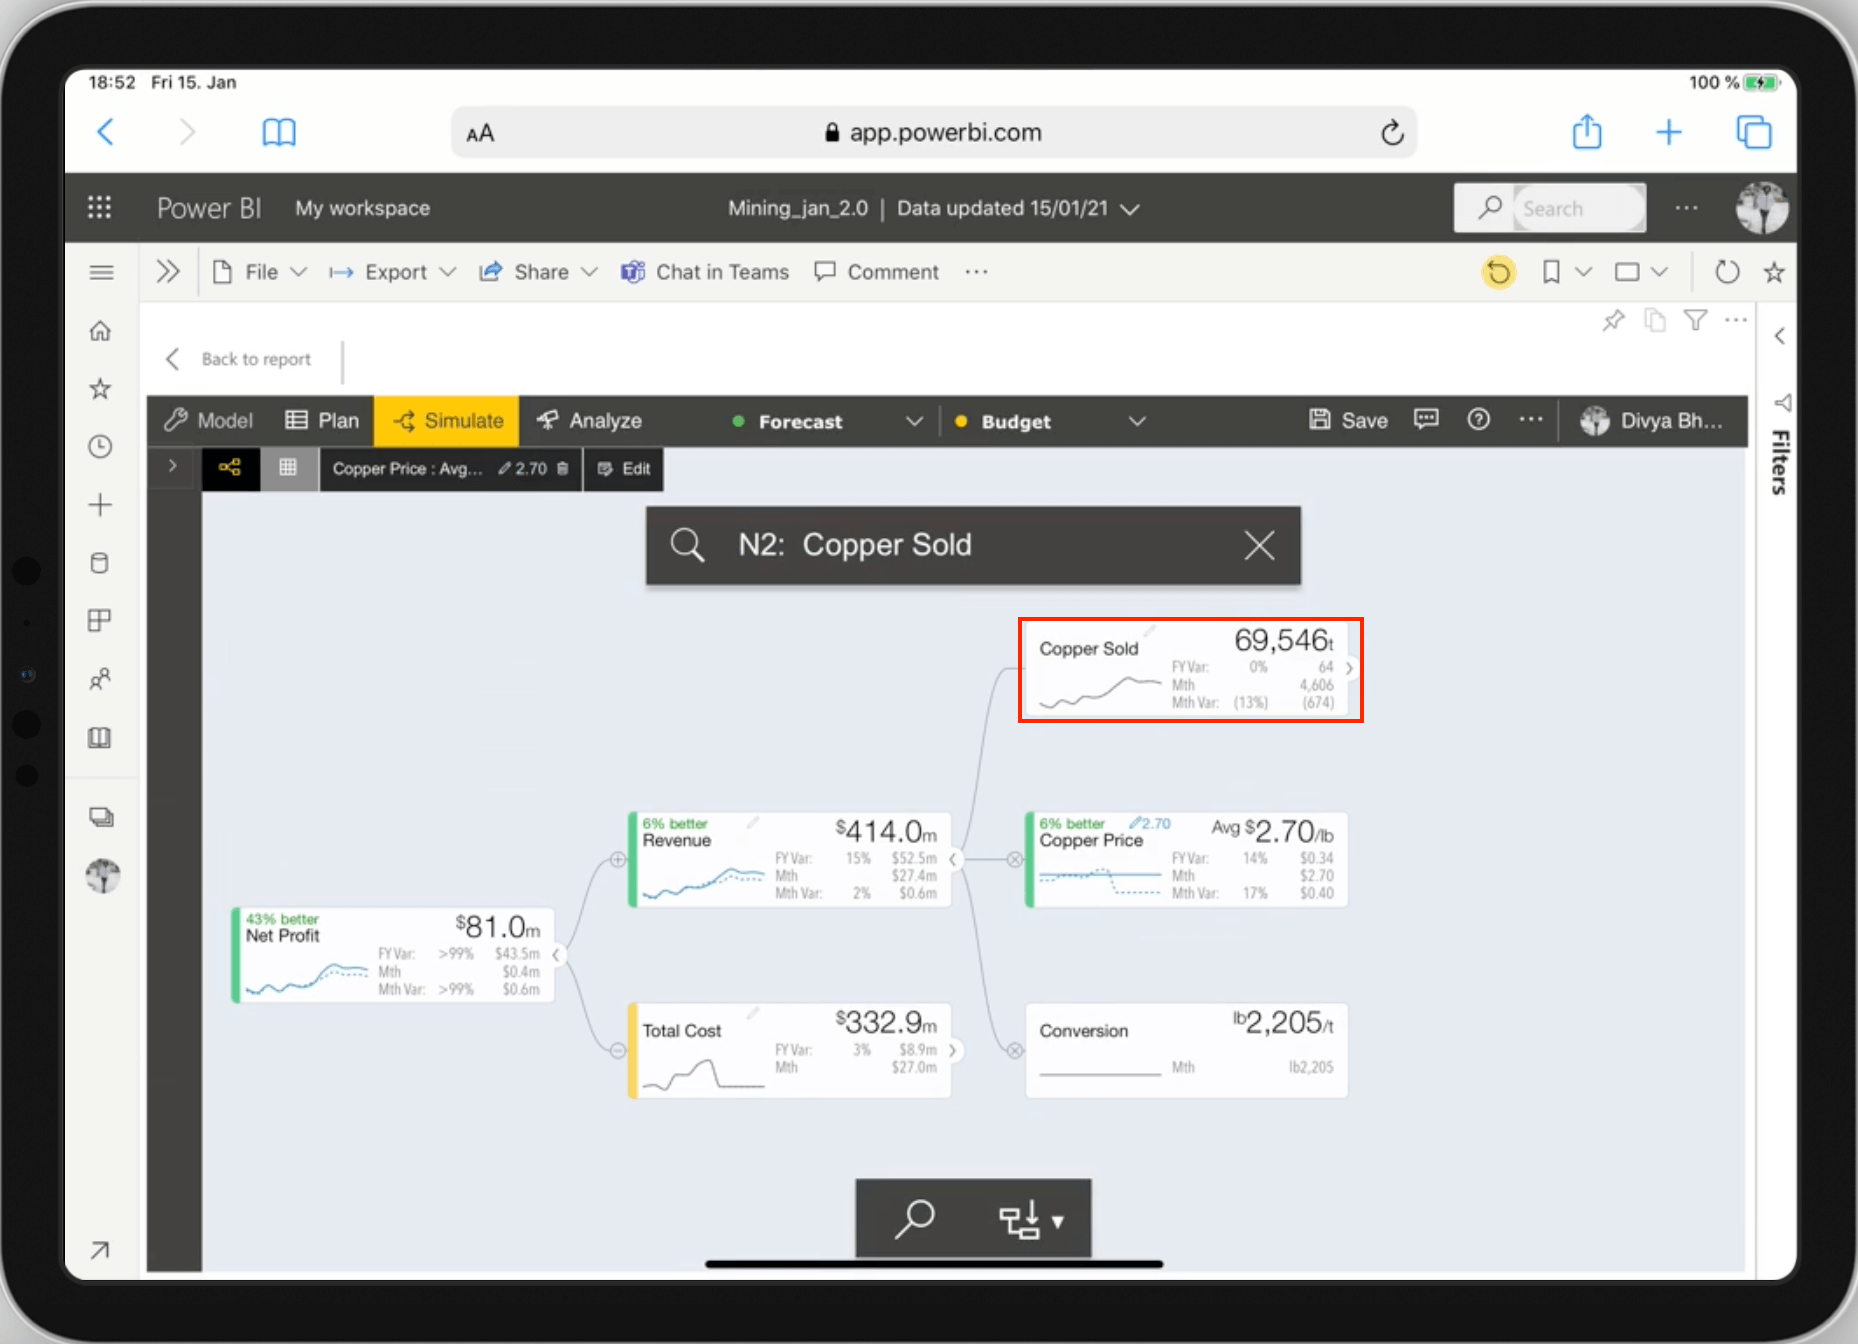
The searched node is selected in tree view
Similarly ,in the Table view, the searched node is displayed and expanded up-to its child nodes.
Go-to-level
The Go-to-level option is available only in a Tree view and allows you to select the node-level hierarchy to expand the ValQ model .
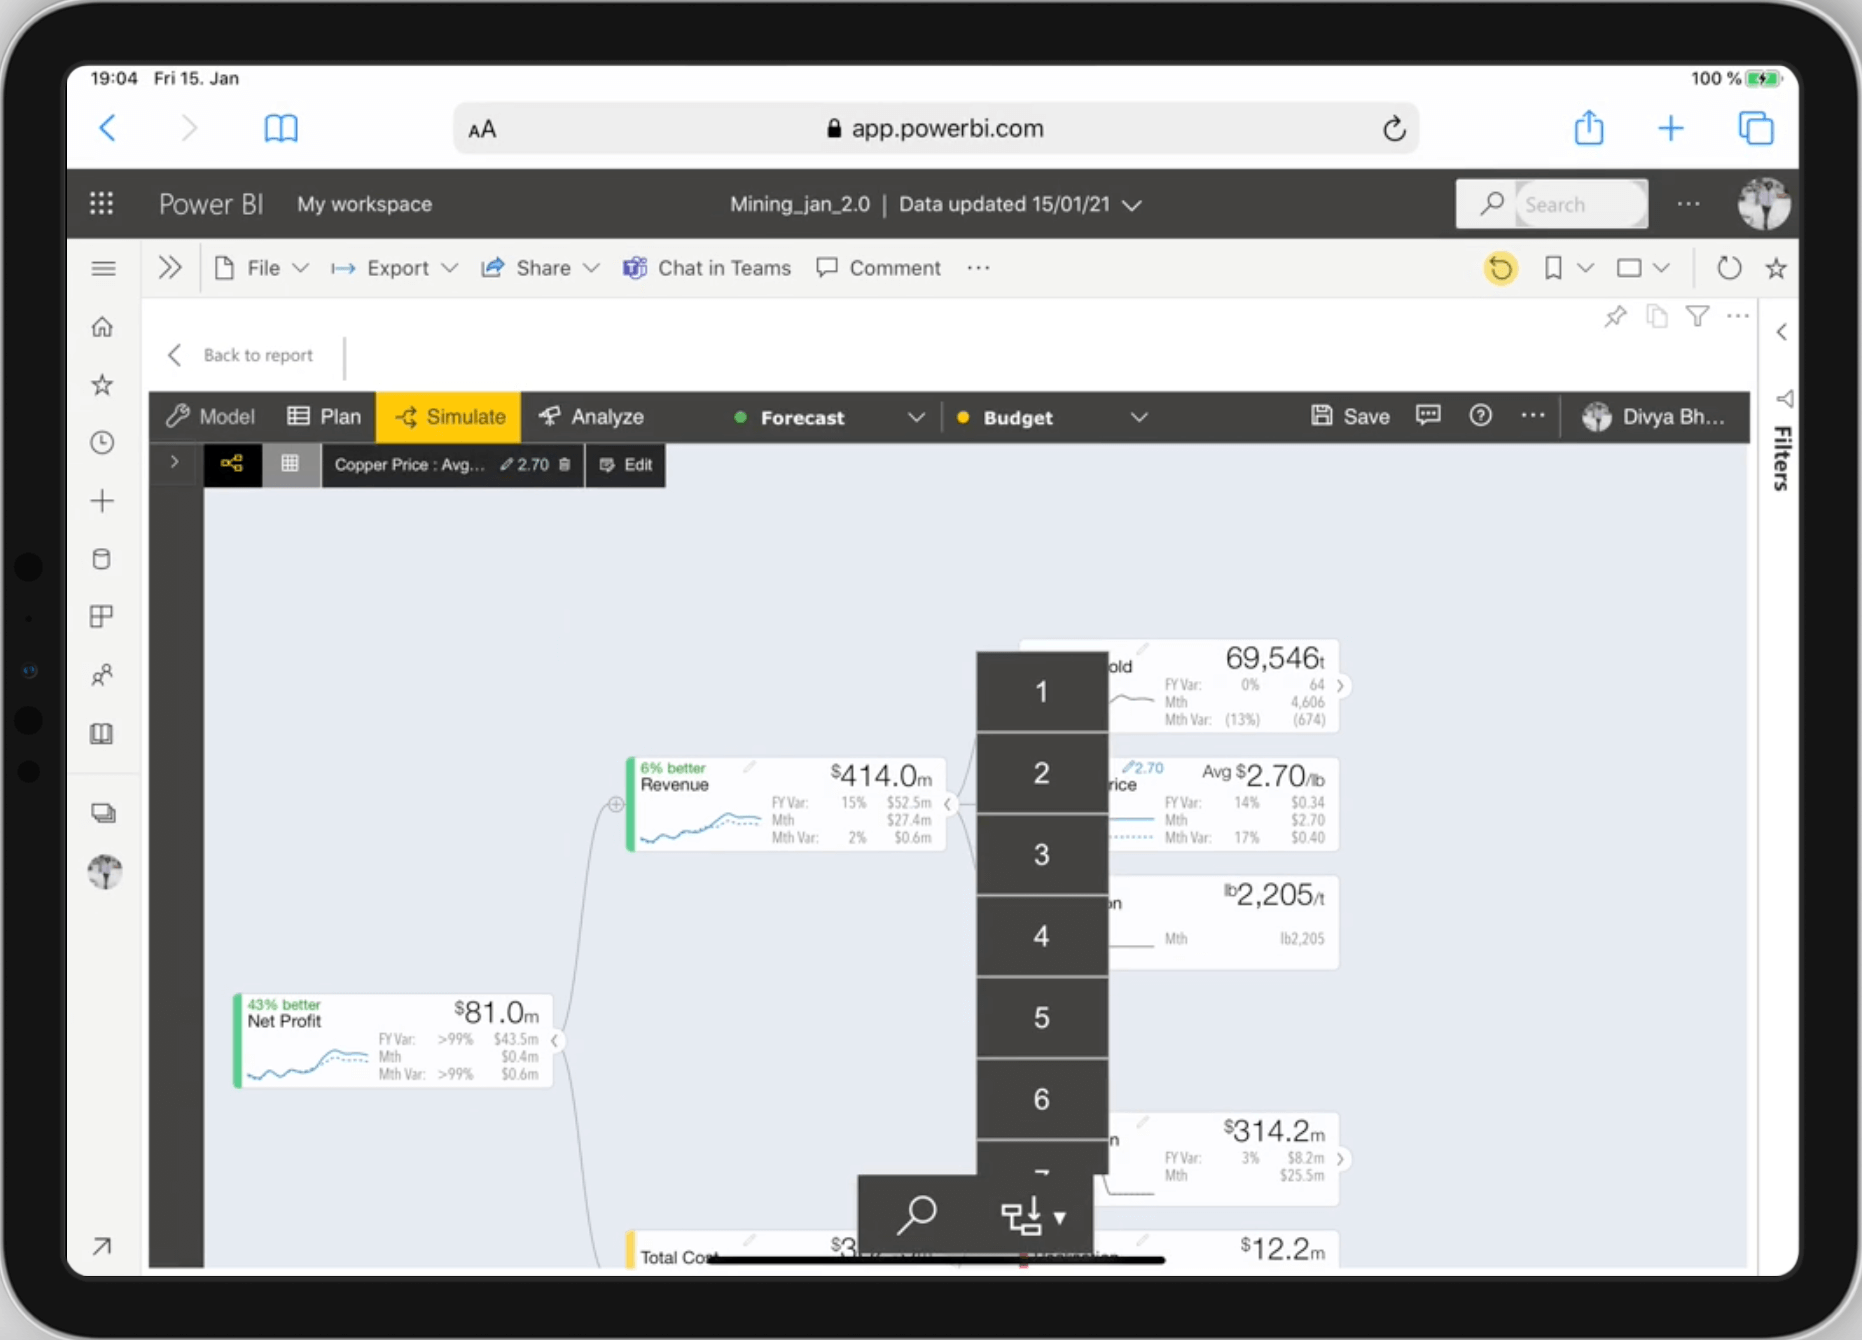
Node-level hierarchy
Node slider
Simulating a node comes in handy with the improved slider. Tap and select a node (Copper Price) to enable the slider. In the below screenshot the node is simulated by 6% by moving the slider.
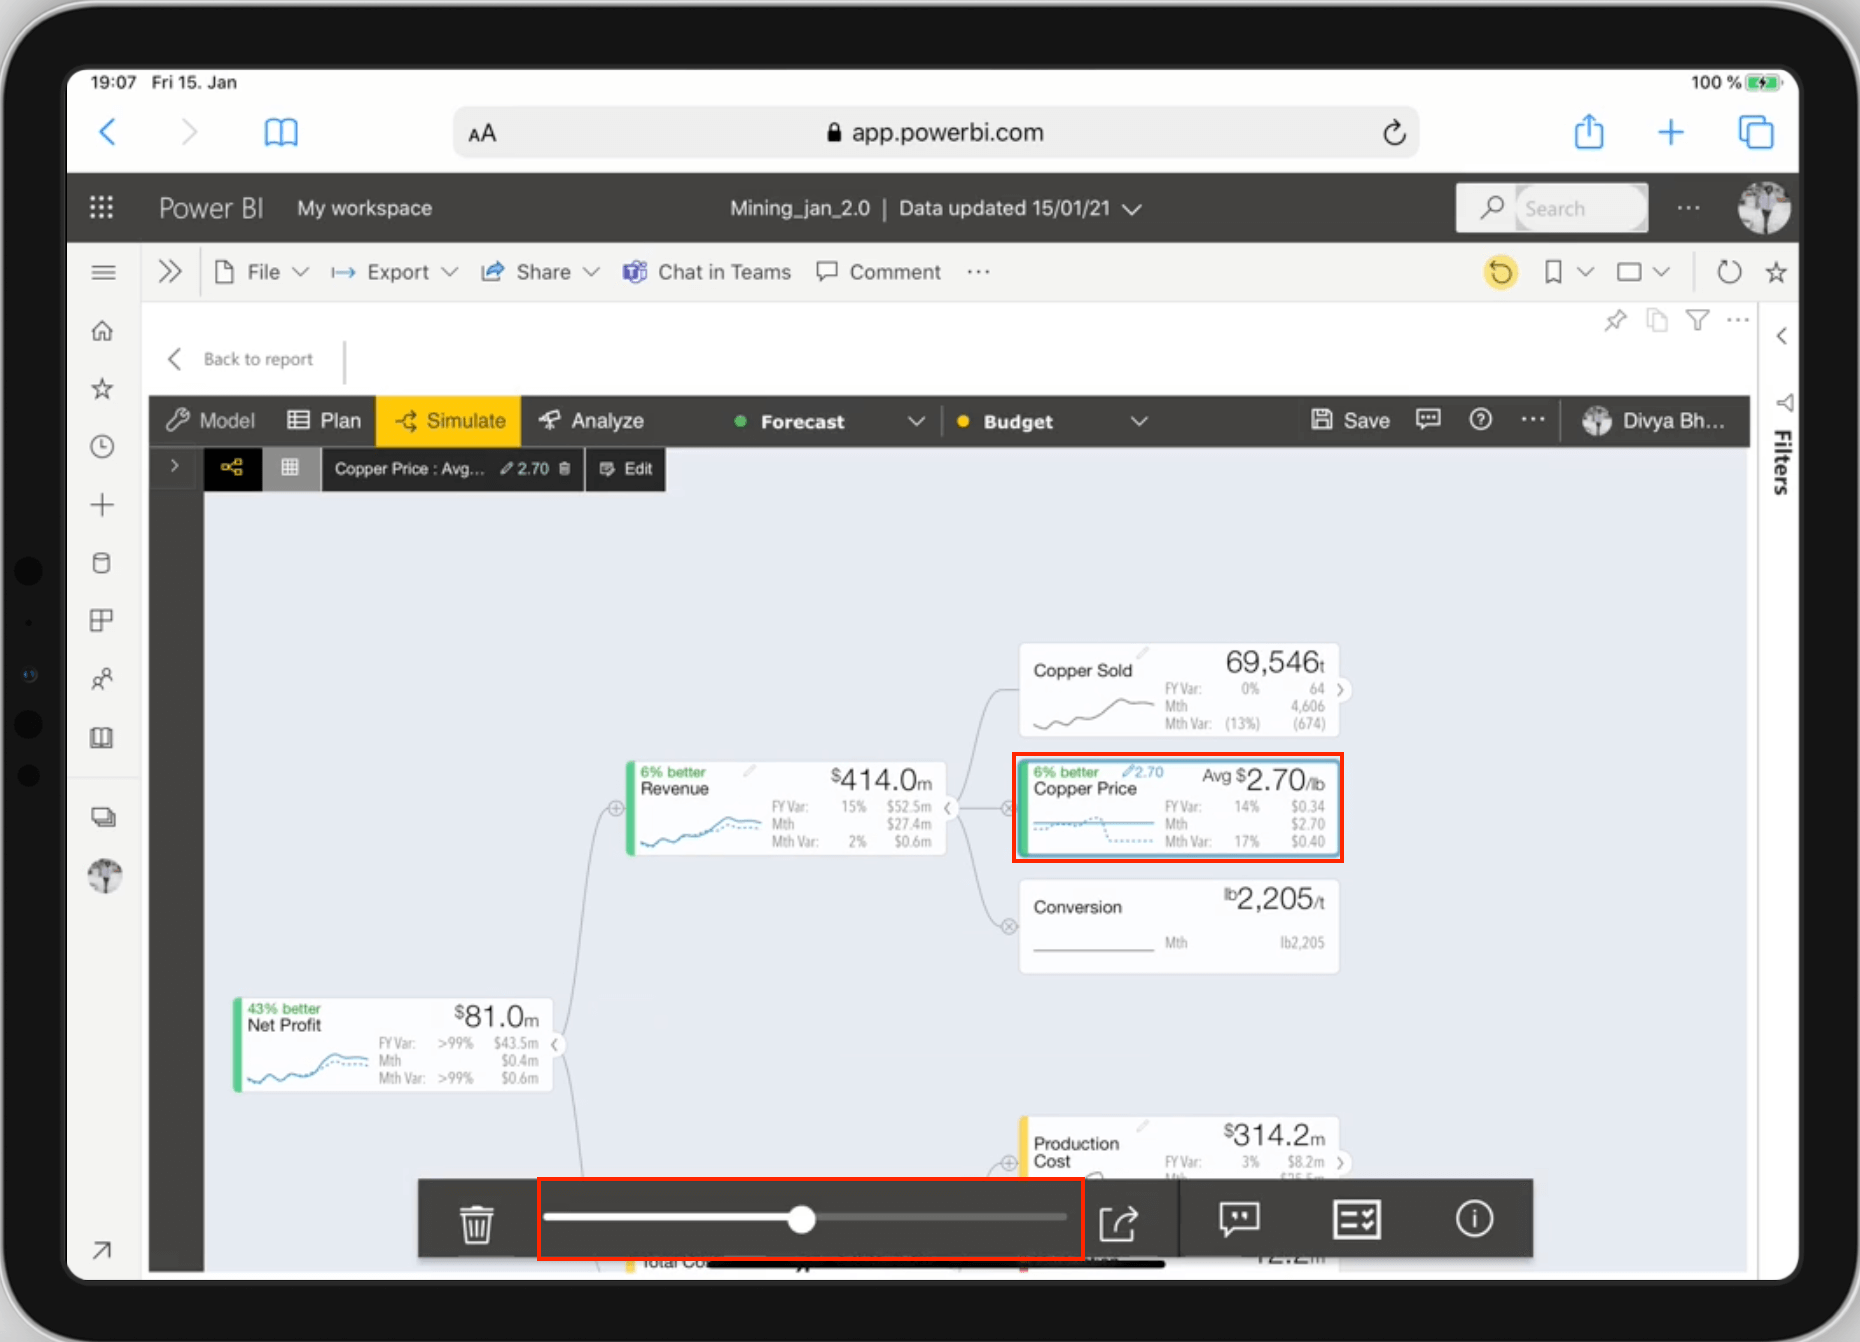
Copper Price node simulated by 6% in tree view
The same node simulation (6% better) can be changed in the Table view.
Comment
The Comment icon allows you to comment on the selected node. To enter new comments, click on the comments icon from the Plan and Simulate tabs respectively. You can also edit/delete the comments owned by you.
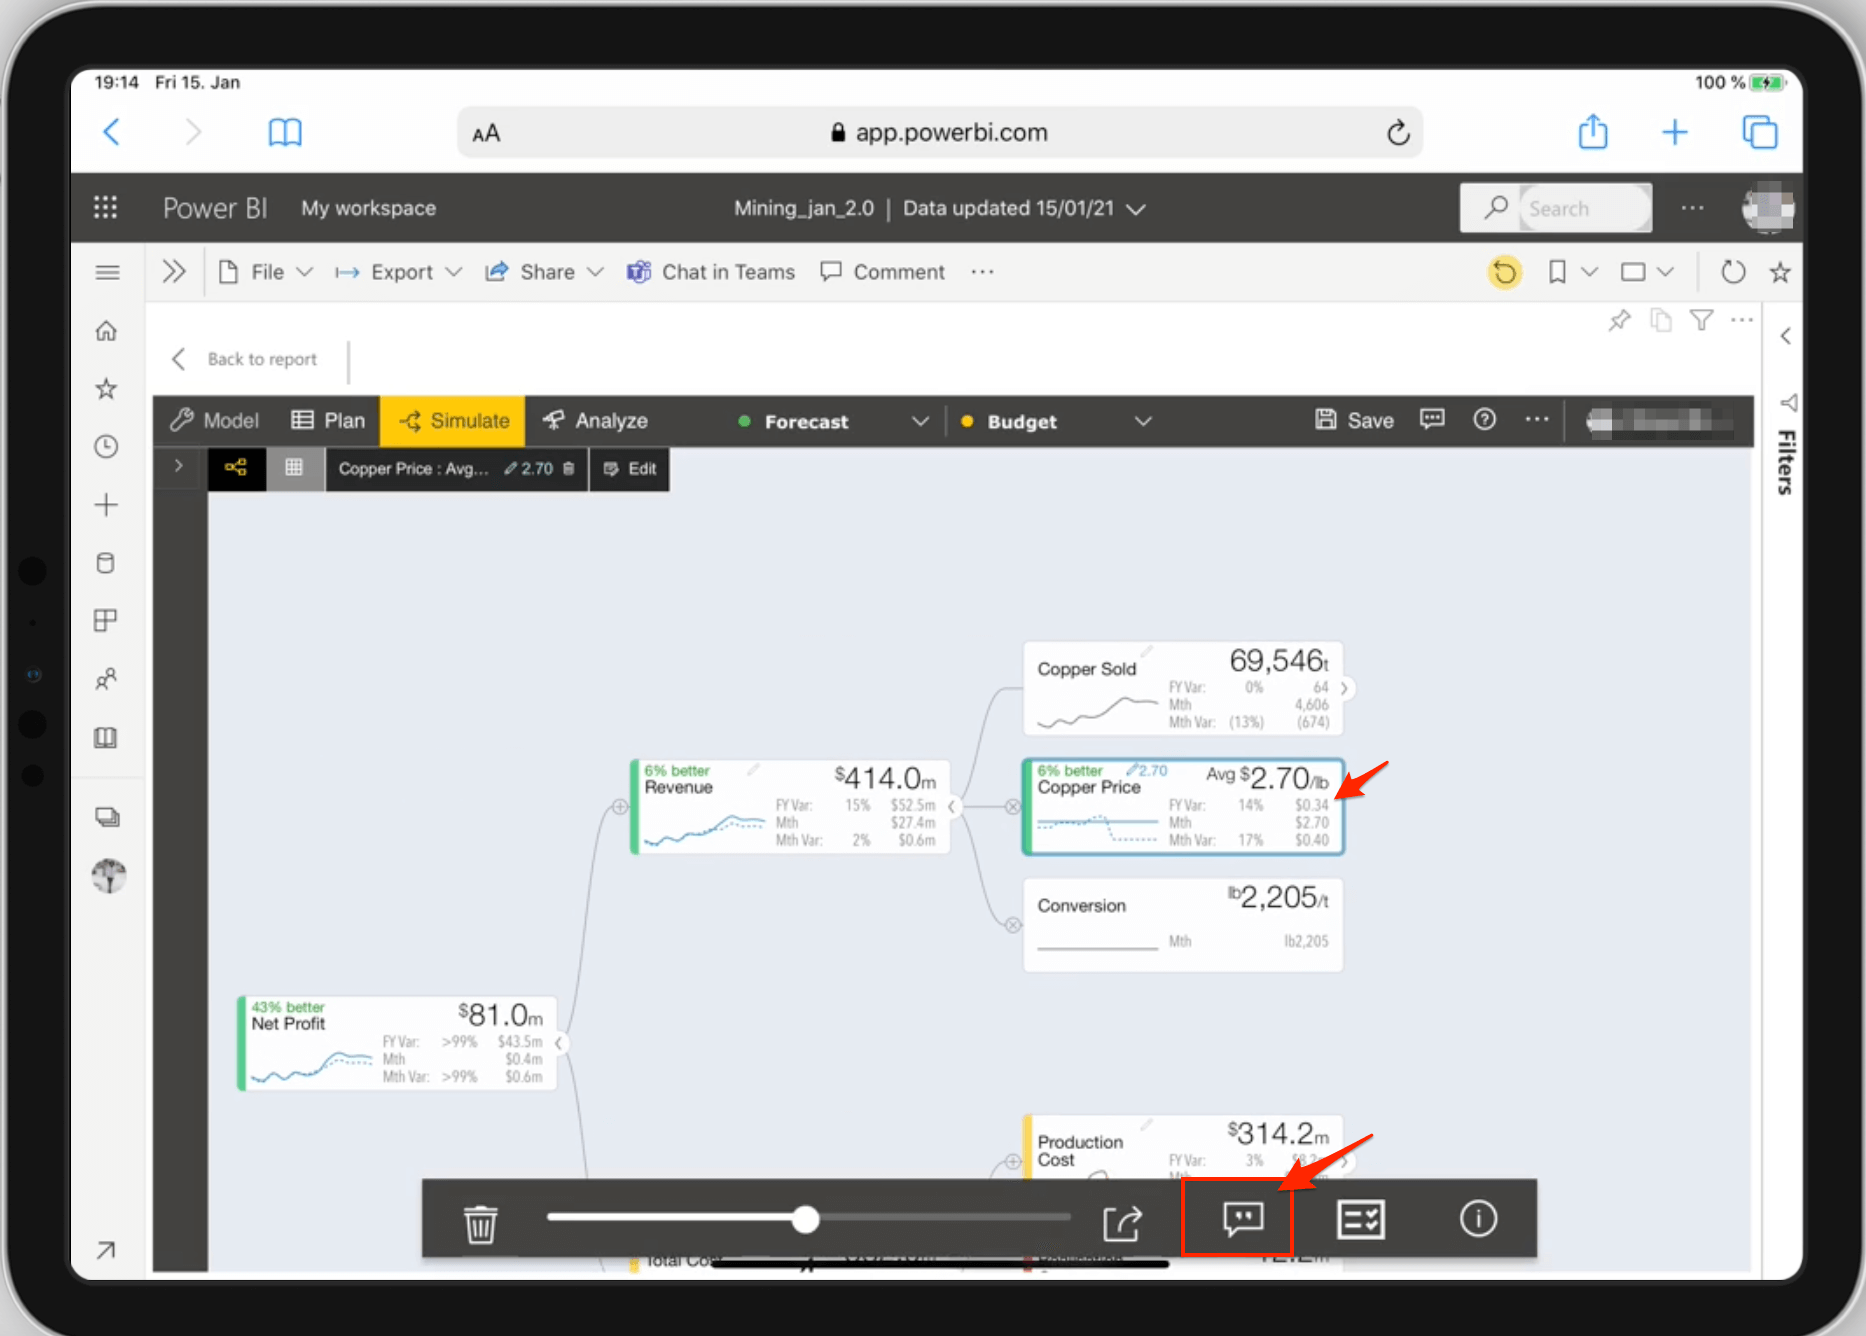
Comment on a node
Node details
Select a node either in Tree/Table view and tap details to view the node details.
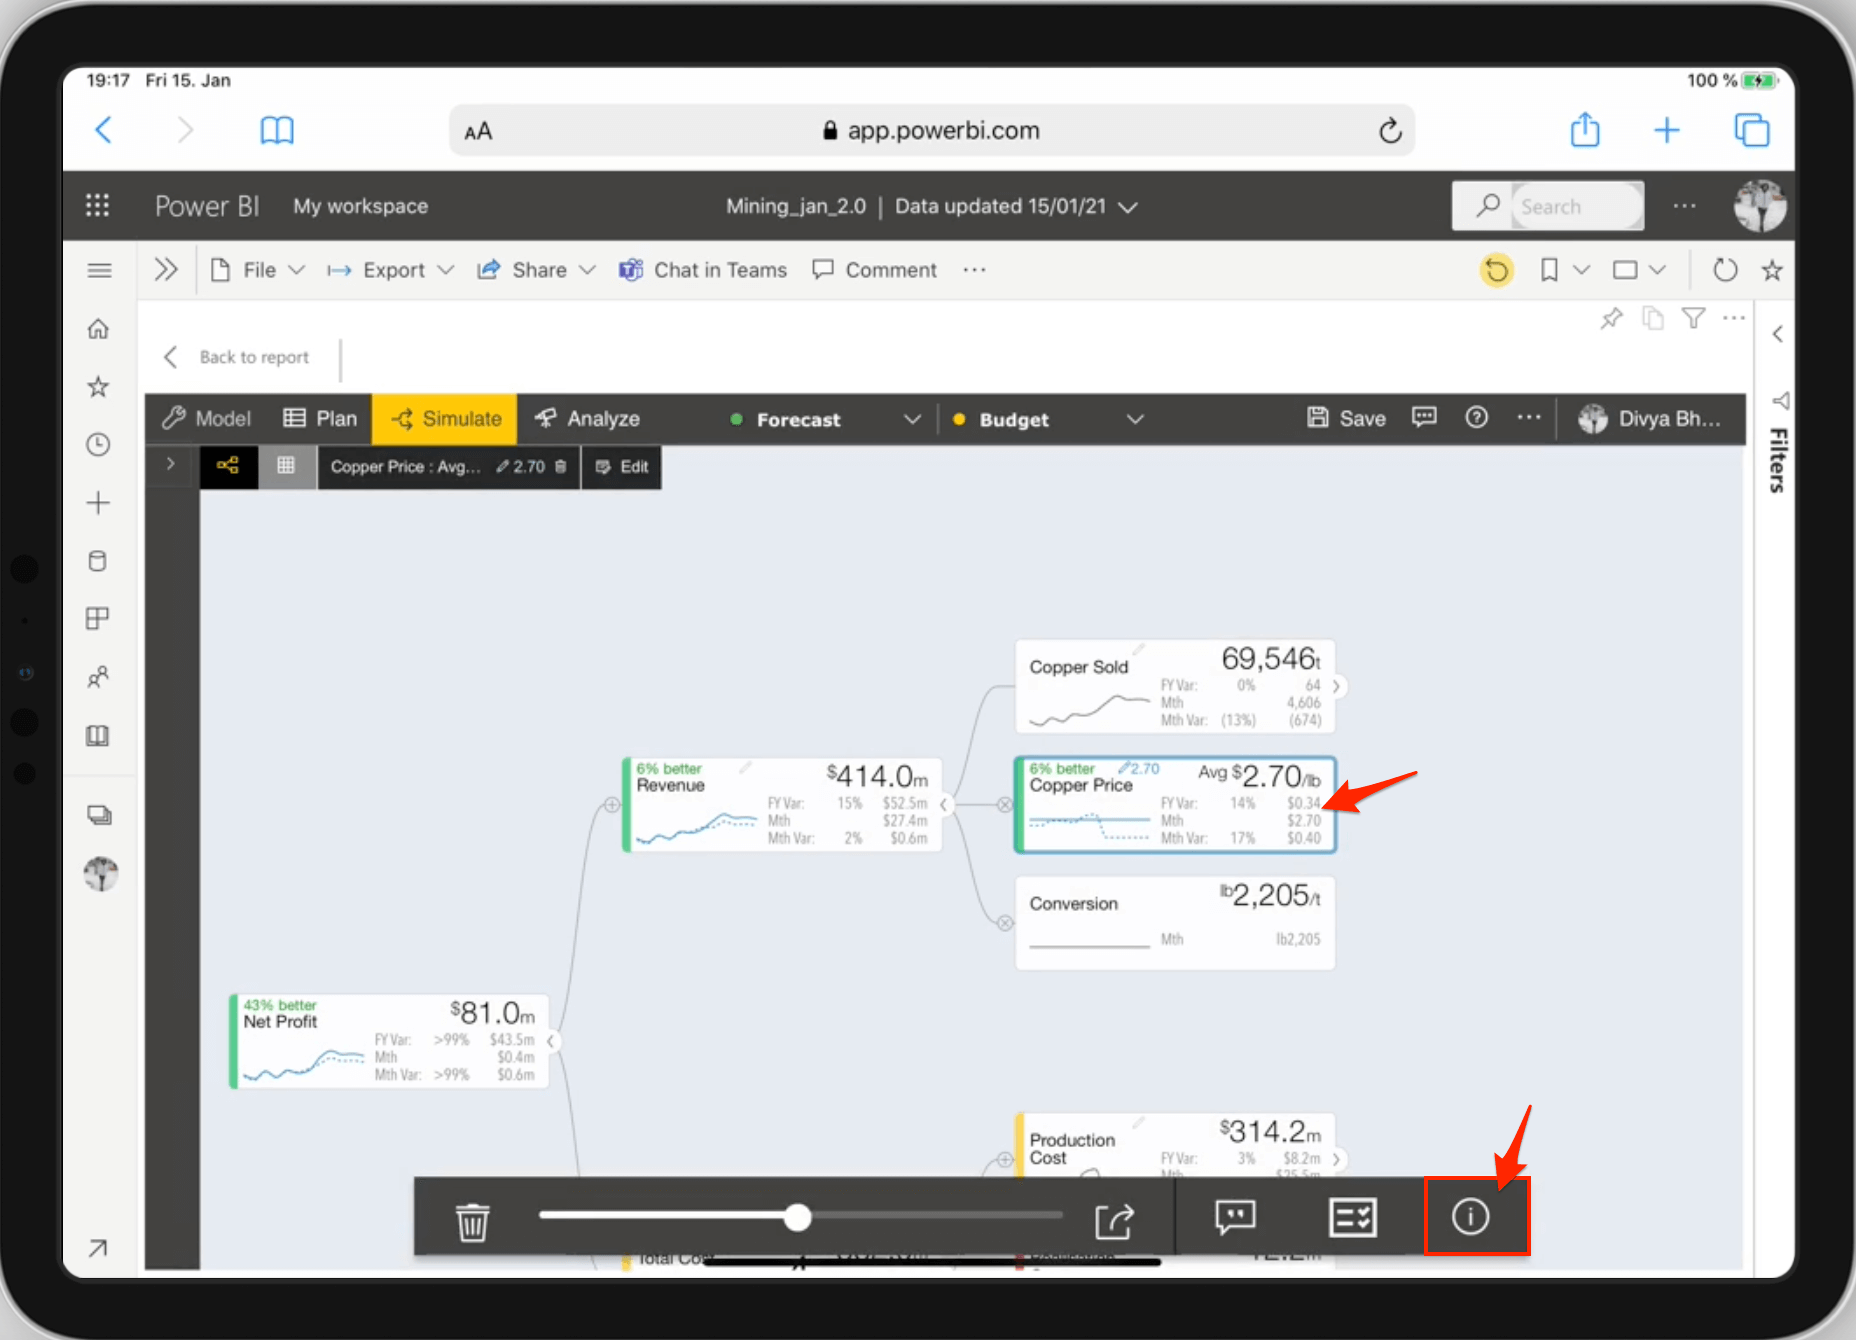
Node details icon in tree view
A detailed node’s information screen :

Node details
Tap close(x) at the top right corner to exit out of the node details screen.
To know more about the exciting features in ValQ 2.0, visit the summary blog here.
Download the latest version here and get started with ValQ Collaborate Edition today.


