
The latest version update – ValQ 2.0 is released with several new features and upgrades such as –
- Enterprise User Security
- Sensitivity Analysis
- Digital Board Room Experience
- Data Access Options and
- Performance Enhancements
In this blog, let’s have a look at these upgrades and the brand-new features of ValQ 2.0 in detail:
1. Enterprise User Security
ValQ now introduces security features that allow or restrict access at different levels – models/nodes, scenarios, planning series.
- The users or groups can be assigned to different roles like Admin, Viewer, and Analyzer at the model level
- Series/ scenarios can be shared with users/groups
- Series/ scenarios can be marked as private
- Nodes can be restricted to users/groups
- Group management can be done from the Admin Console
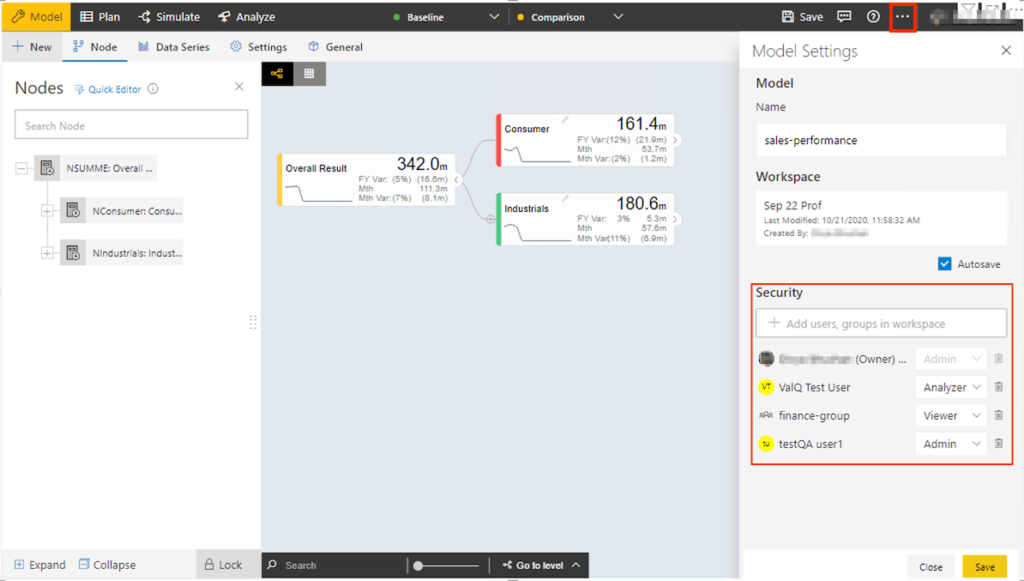
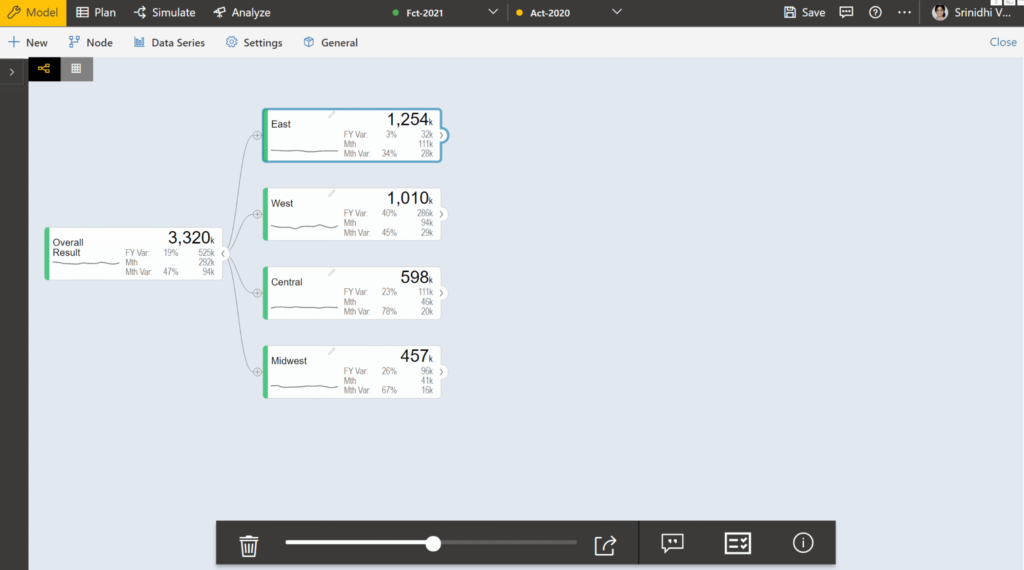
Model Access
In the Model, Admin can add/edit/delete the nodes. They can configure the ‘share’ settings for the model. Analyzer and Viewer do not have access to the Model settings.
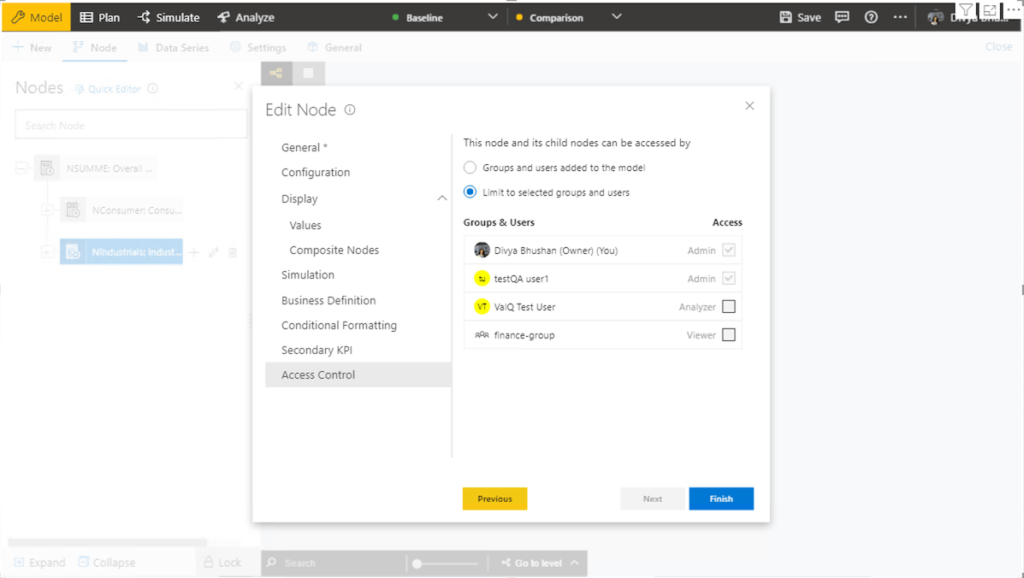
Node Access
You can provide node level access to users/groups added to the model. To set up node level access :
- Select the Node and click the ’edit’ icon next to the node.
- In the Node Config pop-up, select ‘Access Control’to set node-level permissions.
Scenario Access
On the Simulate tab, select the ‘Scenario’ to be shared and click the share icon next to the scenario. This will open the share settings pop-up, where :
- Scenarios can be shared with users/groups
- Scenarios can be marked as private
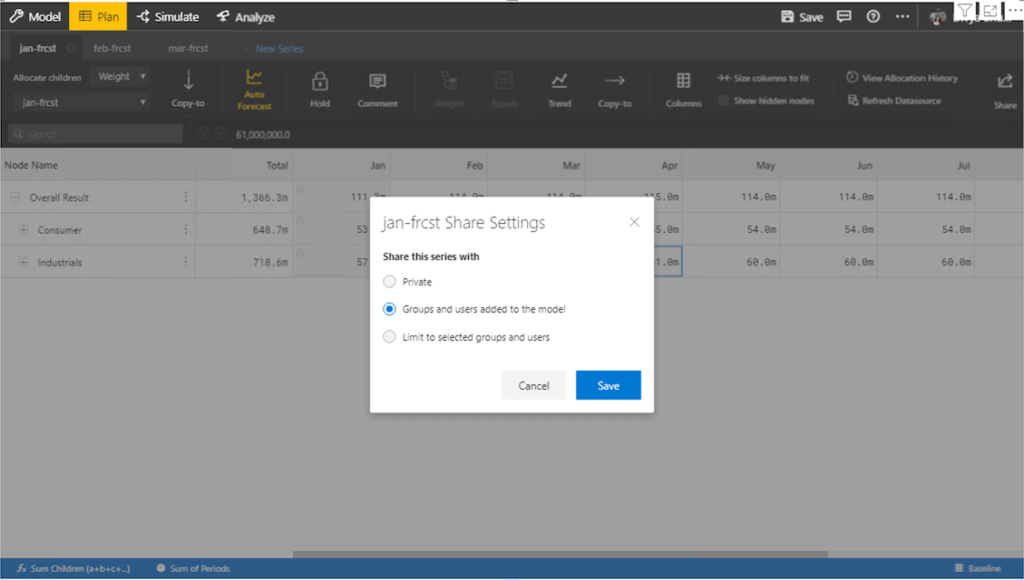
Series Access
Click on the ‘share’ icon on the planning grid to configure the share settings.
- Series can be shared with users/groups
- Series can be marked as private
To learn more about how enterprise user security works , click here.
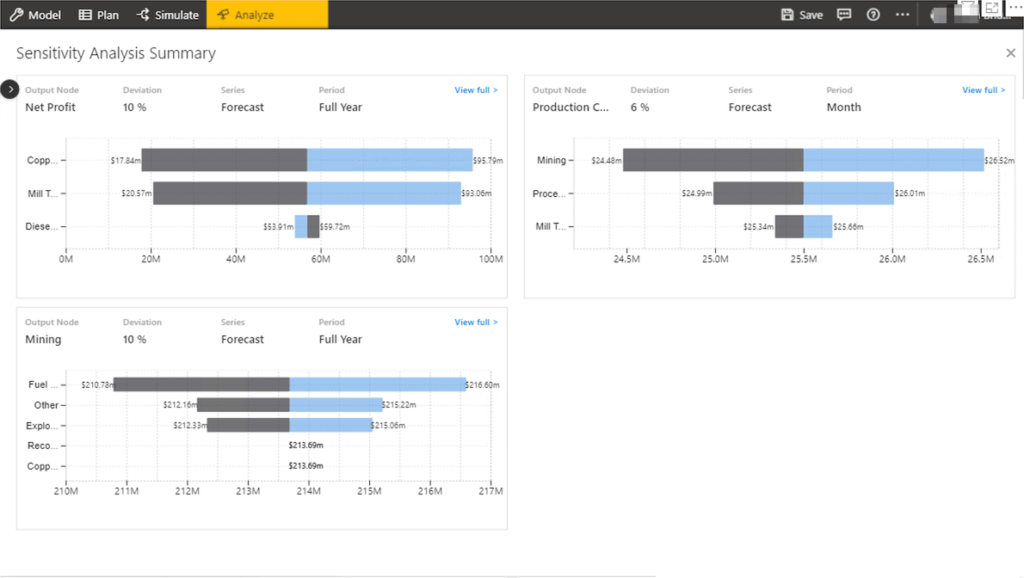
2. Sensitivity Analysis
In a business model, you can now analyze how different input variables affect the selected target node in the form of a tornado chart. The impact of the simulations from the input nodes will be shown on the output node. Multiple analyses can be created by clicking on the ‘New Tab’ button.
Click on the ‘View Summary’ button for a consolidated view of all analyses.
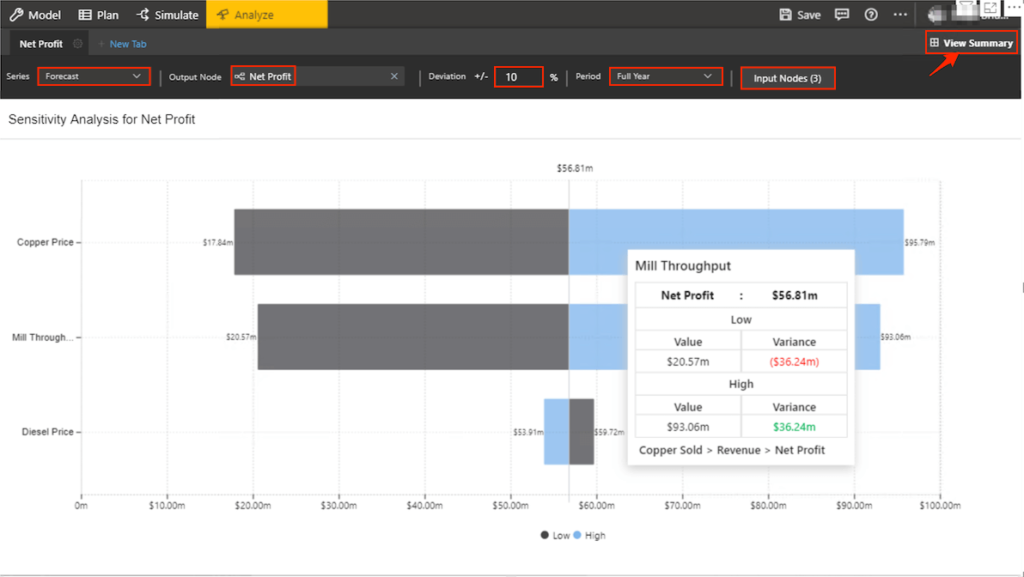
The image given below shows the Analysis Summary.
To read more on Sensitivity Analysis in ValQ, click here
3. Digital Board Room Experience
With this new update, ValQ provides optimized touch support for better interaction on Tablets, Touch TV, and Mobile devices. ValQ will automatically detect the touch device and enable the touch features. You can also enable/disable the touch support functionality and switch back to Desktop controls.
These new updates in ValQ enables a digital board room experience for the users. To learn more about it, click here.
4. Data Access Options
ValQ offers multiple data access options for exporting the data, model, scenarios, analysis.
- Export series and scenario data in a csv format
- Export series and scenario data with a secured URL
- Excel downloads for all scenarios, scenario comparison data
- Downloads for model configuration
- Writeback series and scenario data to a URL/endpoint
A few applications :
- Import data into other visuals or applications
- Use Excel or other tools for data analysis
- Build models quickly with the Import Model feature
To learn more about this feature on ValQ , click here.
5. Performance Enhancements in ValQ 2.0
ValQ has now included In-Memory Database for faster model uploads and data export.
Download the latest version here and get started with ValQ Collaborate Edition today.


