
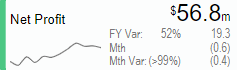
In the previous blog, we saw how nodes can deliver insights on key performance indicators. A sample node widget is shown in Image 1.
In this blog, we’ll see how to access additional insights on the KPIs.
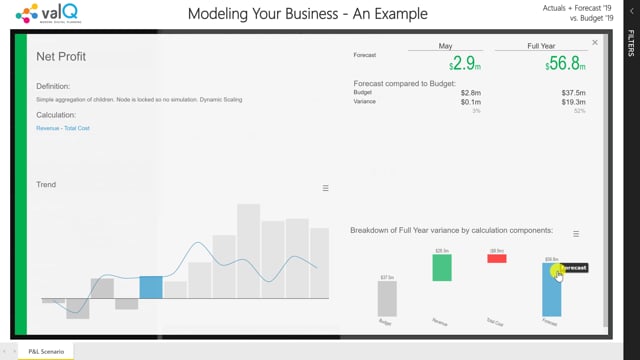
When you click on any node in the ValQ model, you’ll be presented with a pop-up screen such as the one shown in Image 2.
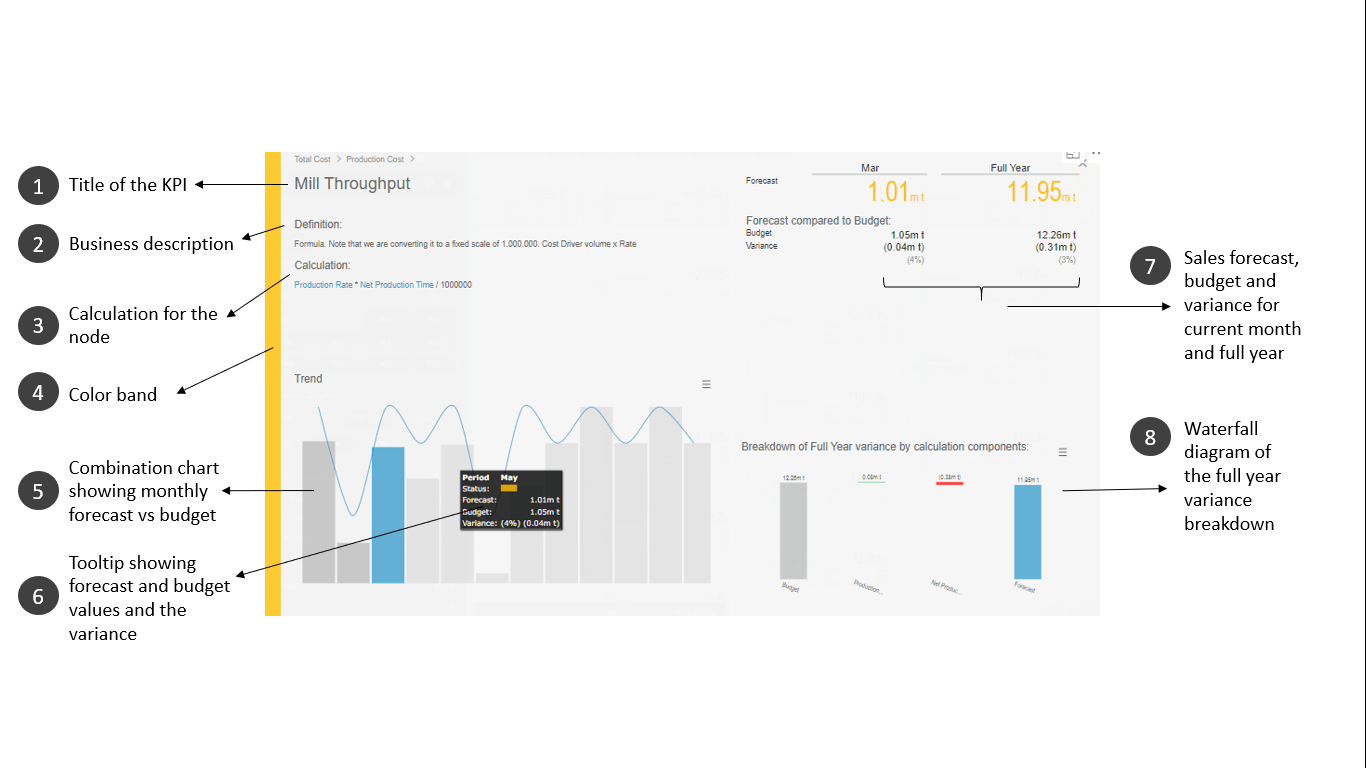
This screen contains additional information on the selected node such as;
1. Title of the KPI
2. Business description – this is very helpful since there is the possibility of users misinterpreting what the KPI exactly measures (e.g. whether net sales excludes discounts)
3. Formula indicating how the KPI is calculated. This can refer to any node in the ValQ model and use complex functions in addition to simple arithmetic functions.
4. A color band at the left of the screen which indicates how the KPI is performing against the budget.
5. Combination chart in which
- The blue line represents the budget
- Dark grey bars represent the actuals for the elapsed period,
- Light grey bars represent forecast for the remaining period and
- Blue bar represents the current month
6. When you hover over each bar in the combination chart, you can see a tooltip with the forecast/actual and budget values and the variance.
7. Table showing the current month and full year values for both the primary and comparison data along with the variance calculations.
8. Waterfall diagram of the full year variance breakdown which is a variance of the KPI between the budget and the forecast explained in terms of the budget and forecast variances of the calculation components. There will be no waterfall diagram for leaf nodes as they do not have calculation components and instead have data sources.
Note: After you perform simulations on some of the nodes, you would see additional insights in the popup screen – but we’ll cover that in a later blog.
To learn more, tune into one of our ValQ Webinars or try our product for free here.


