
This post is part of our Financial Statements Blog Series.
Profit & Loss statements come in various types and forms.
Each type has its own applicability and purpose. Factors such as the size of the organization, the need (internal vs. external reporting), use case, focus (backward-looking vs. forward-looking), and the audience all determine the choice of the template used.
Let’s look at each of the Profit & Loss/Income Statement types one by one.
- Single Step Income Statement
- Multi-Step Income Statement
- Comparative Income Statement
- Common Size Analysis Income Statement
- Variance P&L Statement
- Segmented P&L Statement
- Driver-based P&L Statement
- Composite P&L Statement
* * *
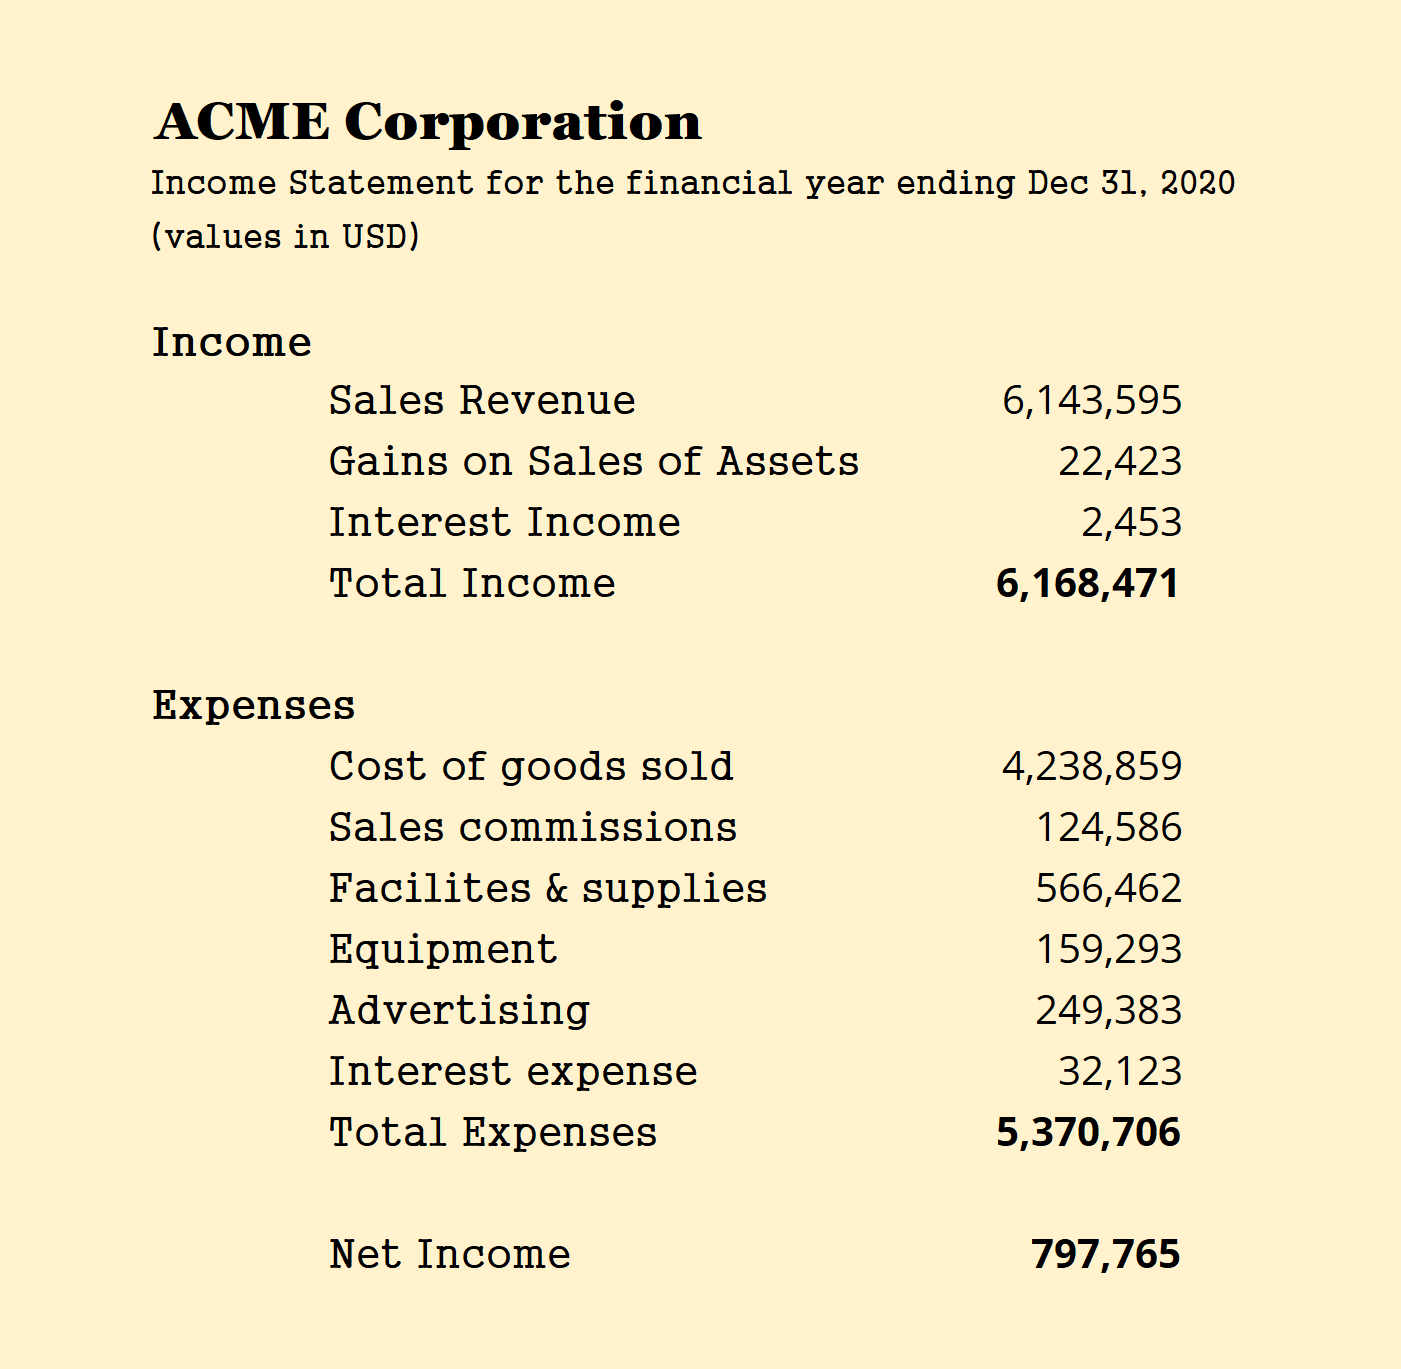
1. Single Step Income Statement
This simplest form of a P&L statement is typically used by small businesses that have fewer line items to report. This type of Income Statement has subtotals only for revenue and expenses.
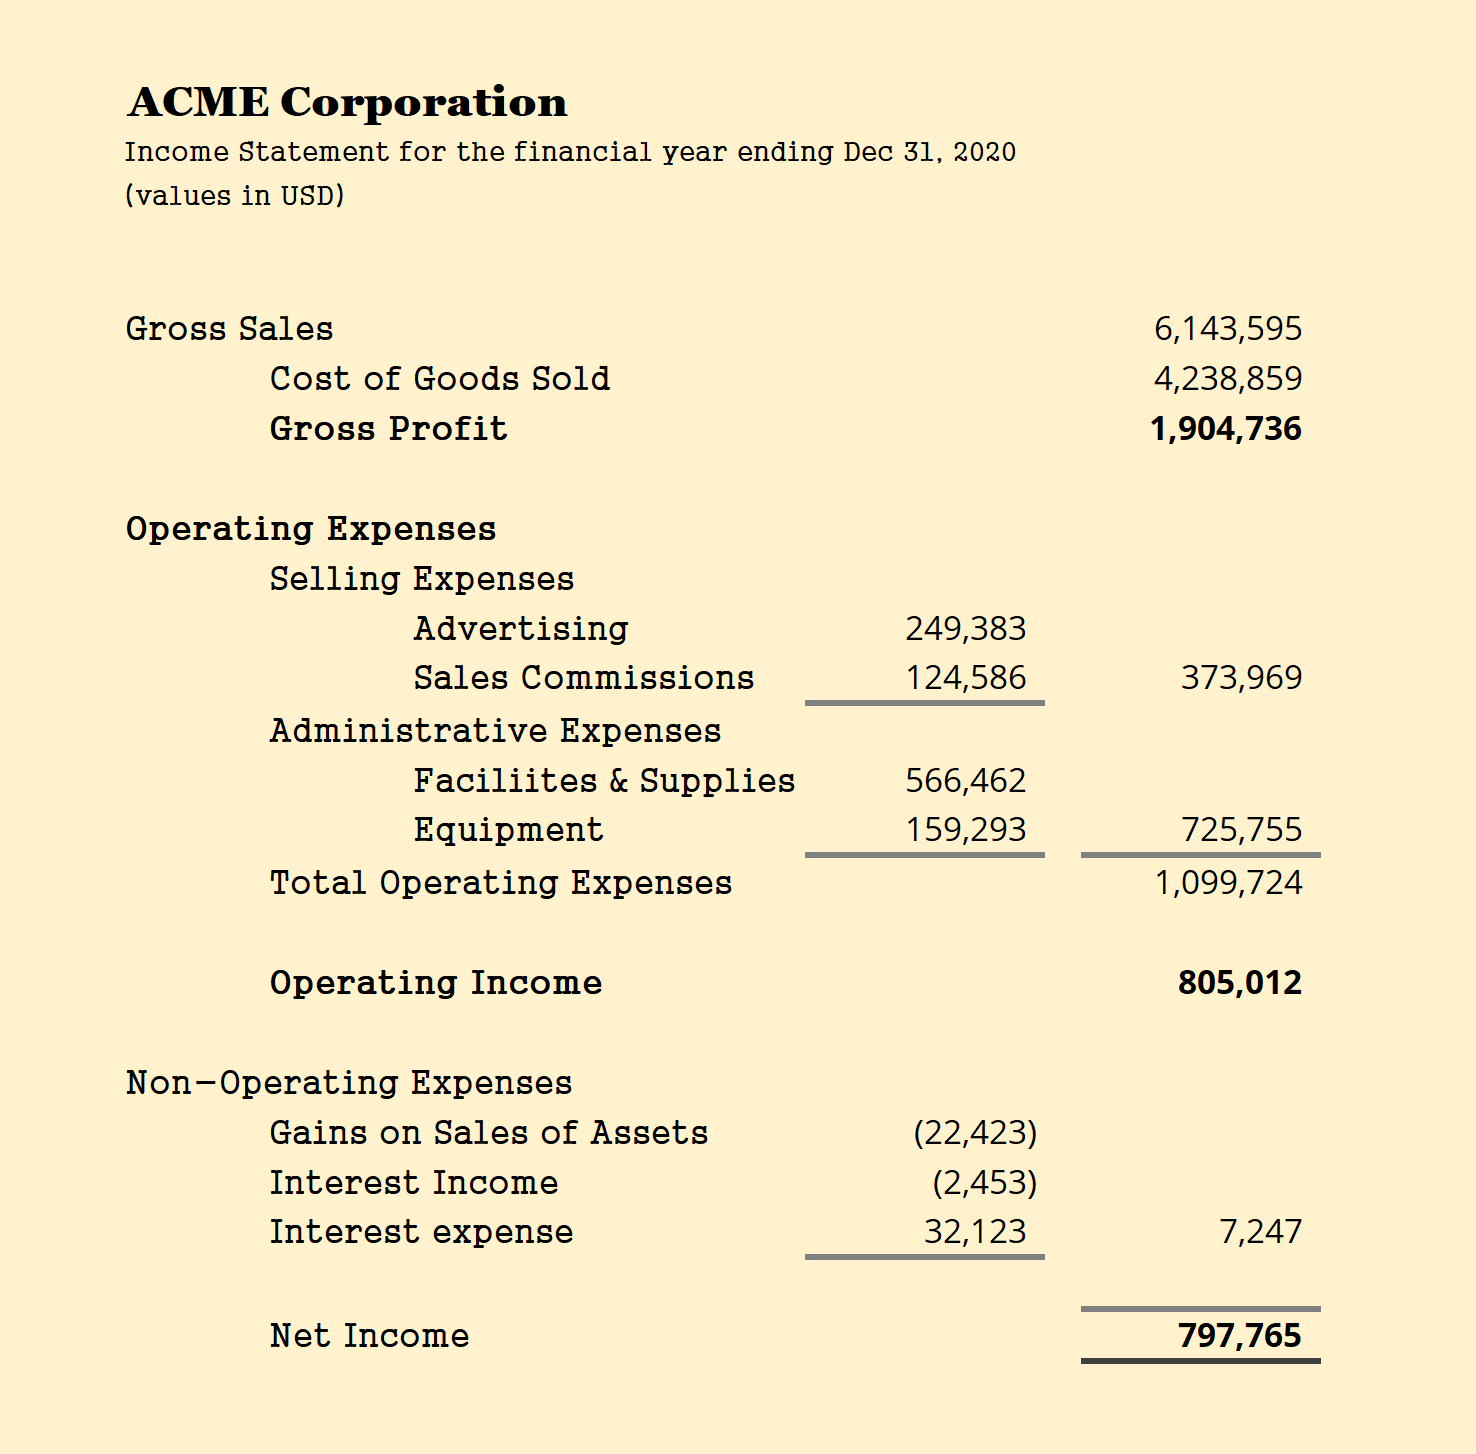
2. Multi-Step Income Statement
This type of income statement is an improvement on the single-step Income Statement. It tends to present subtotals for gross profit and operating income making it easier for comprehension and analysis.
3. Comparative Income Statement
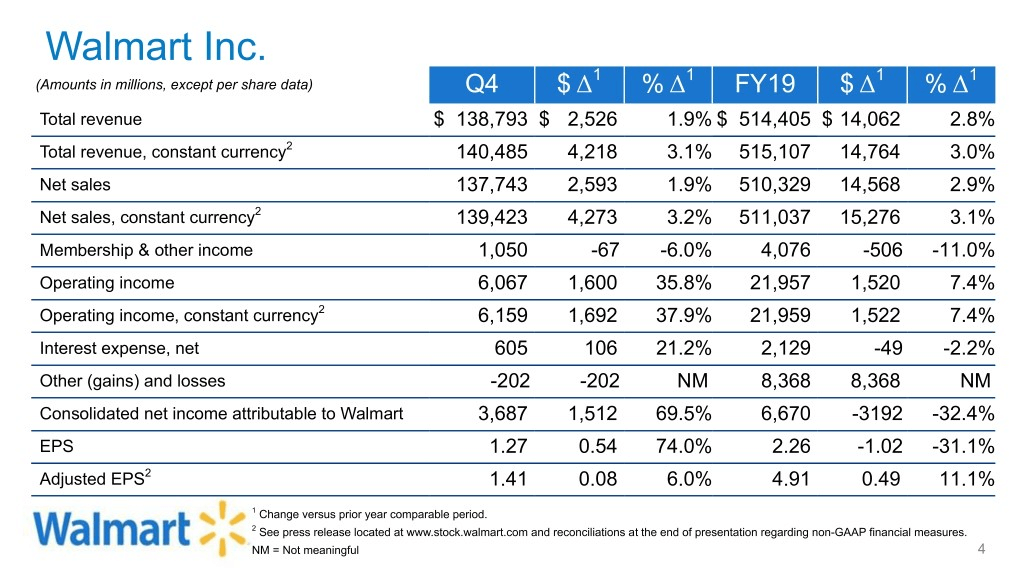
In this type of Income Statement, the performance for multiple periods is placed in adjacent columns. This is the preferred format for financial analysts and features routinely in quarterly and annual reports. A comparative Income Statement for Walmart Inc. for FY’20 is shown below.
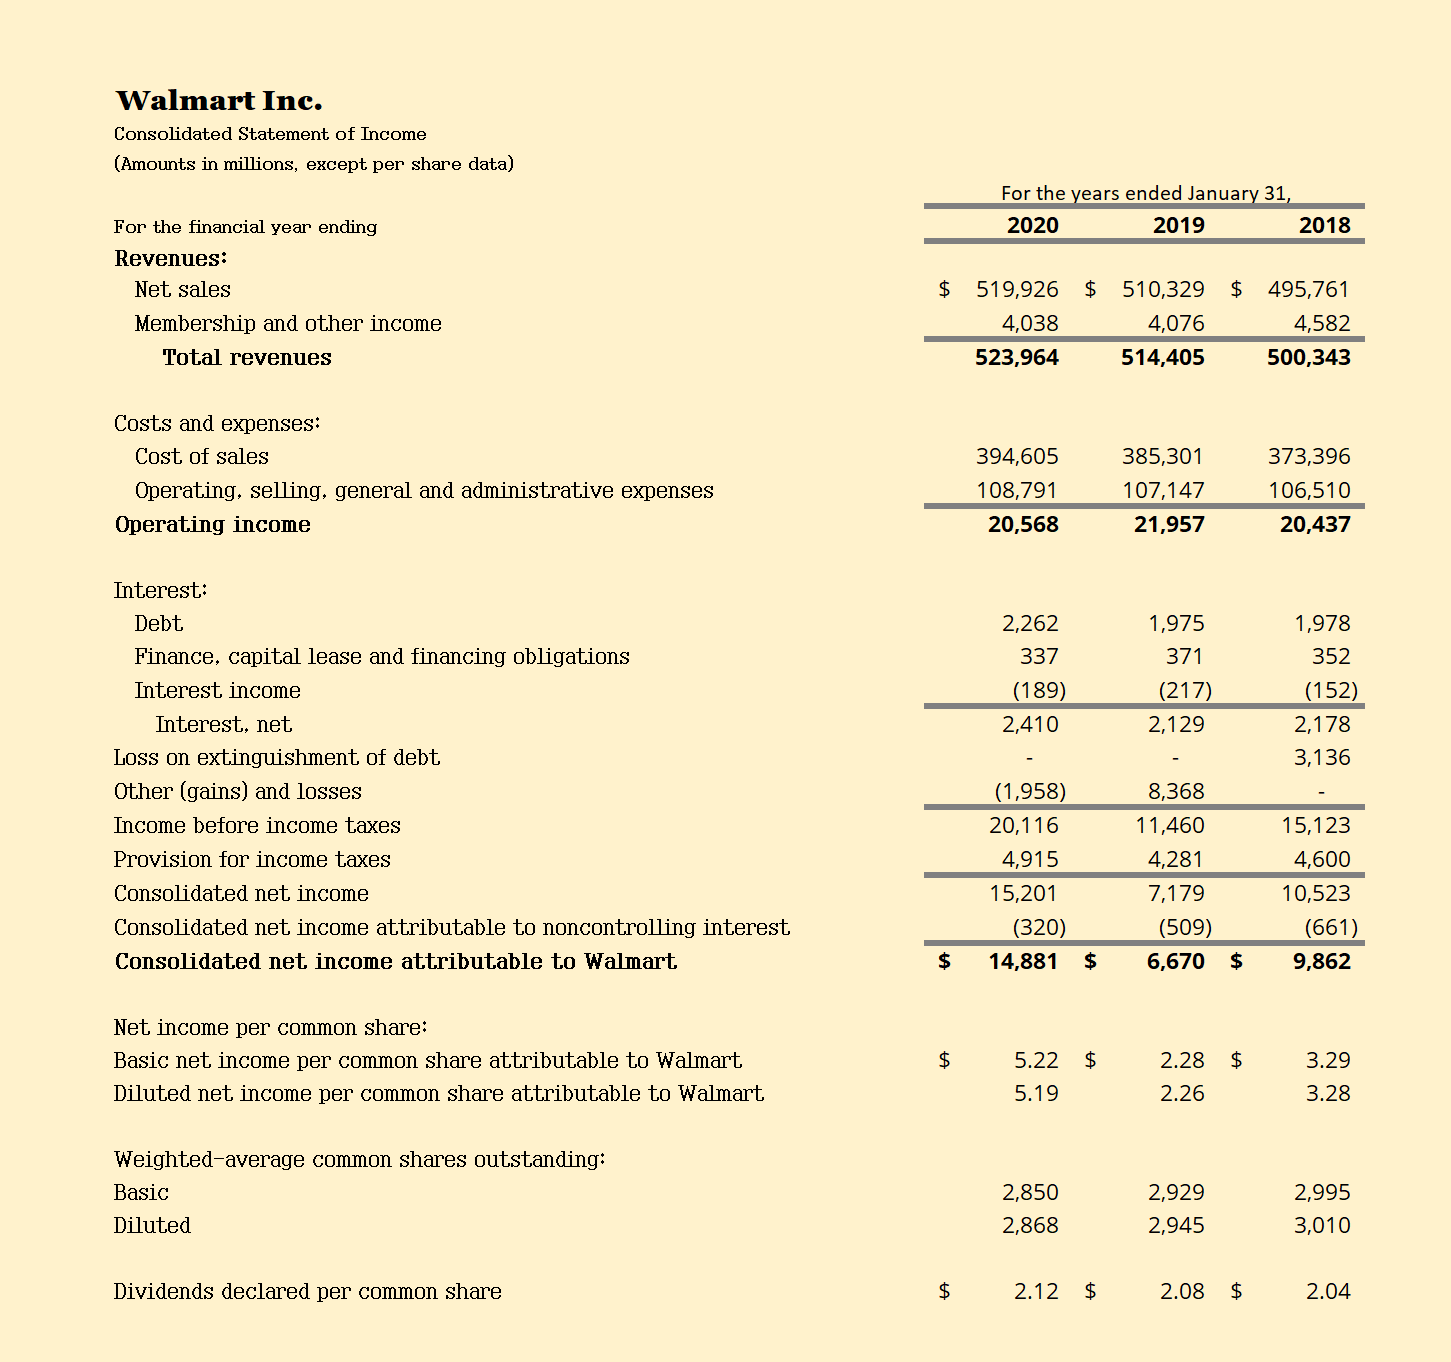
In quarterly reports, you may also see a variation of this template listing the specific quarter’s performance side by side with year-till-date (YTD) performance.
Many popular accounting software like Quickbooks, Xero, and Netsuite generate MIS reports in a similar format, listing P&L reports by month across columns.
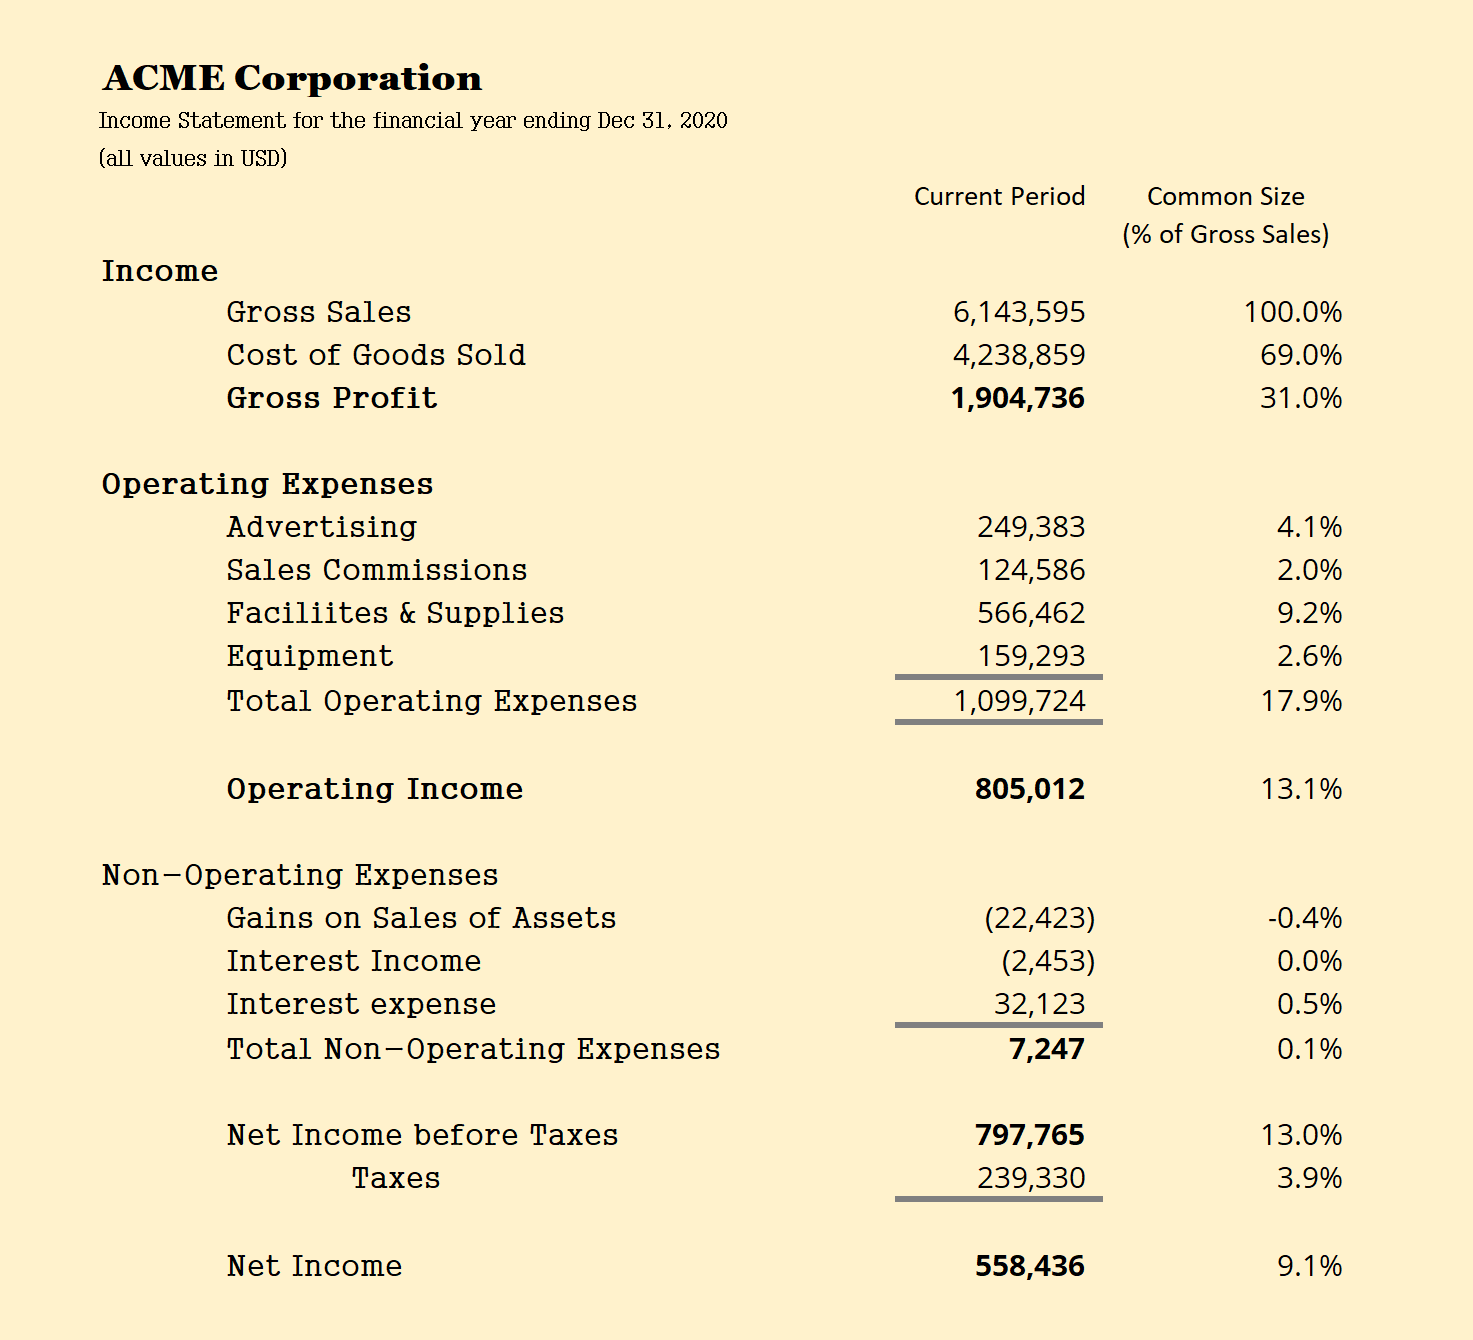
4. Common Size Analysis Income Statement
The Common Size Analysis P&L Statement represents all line items as a % of a chosen metric, typically sales. This type of Income Statement is useful for benchmarking a company’s performance against industry peers of varying sizes.
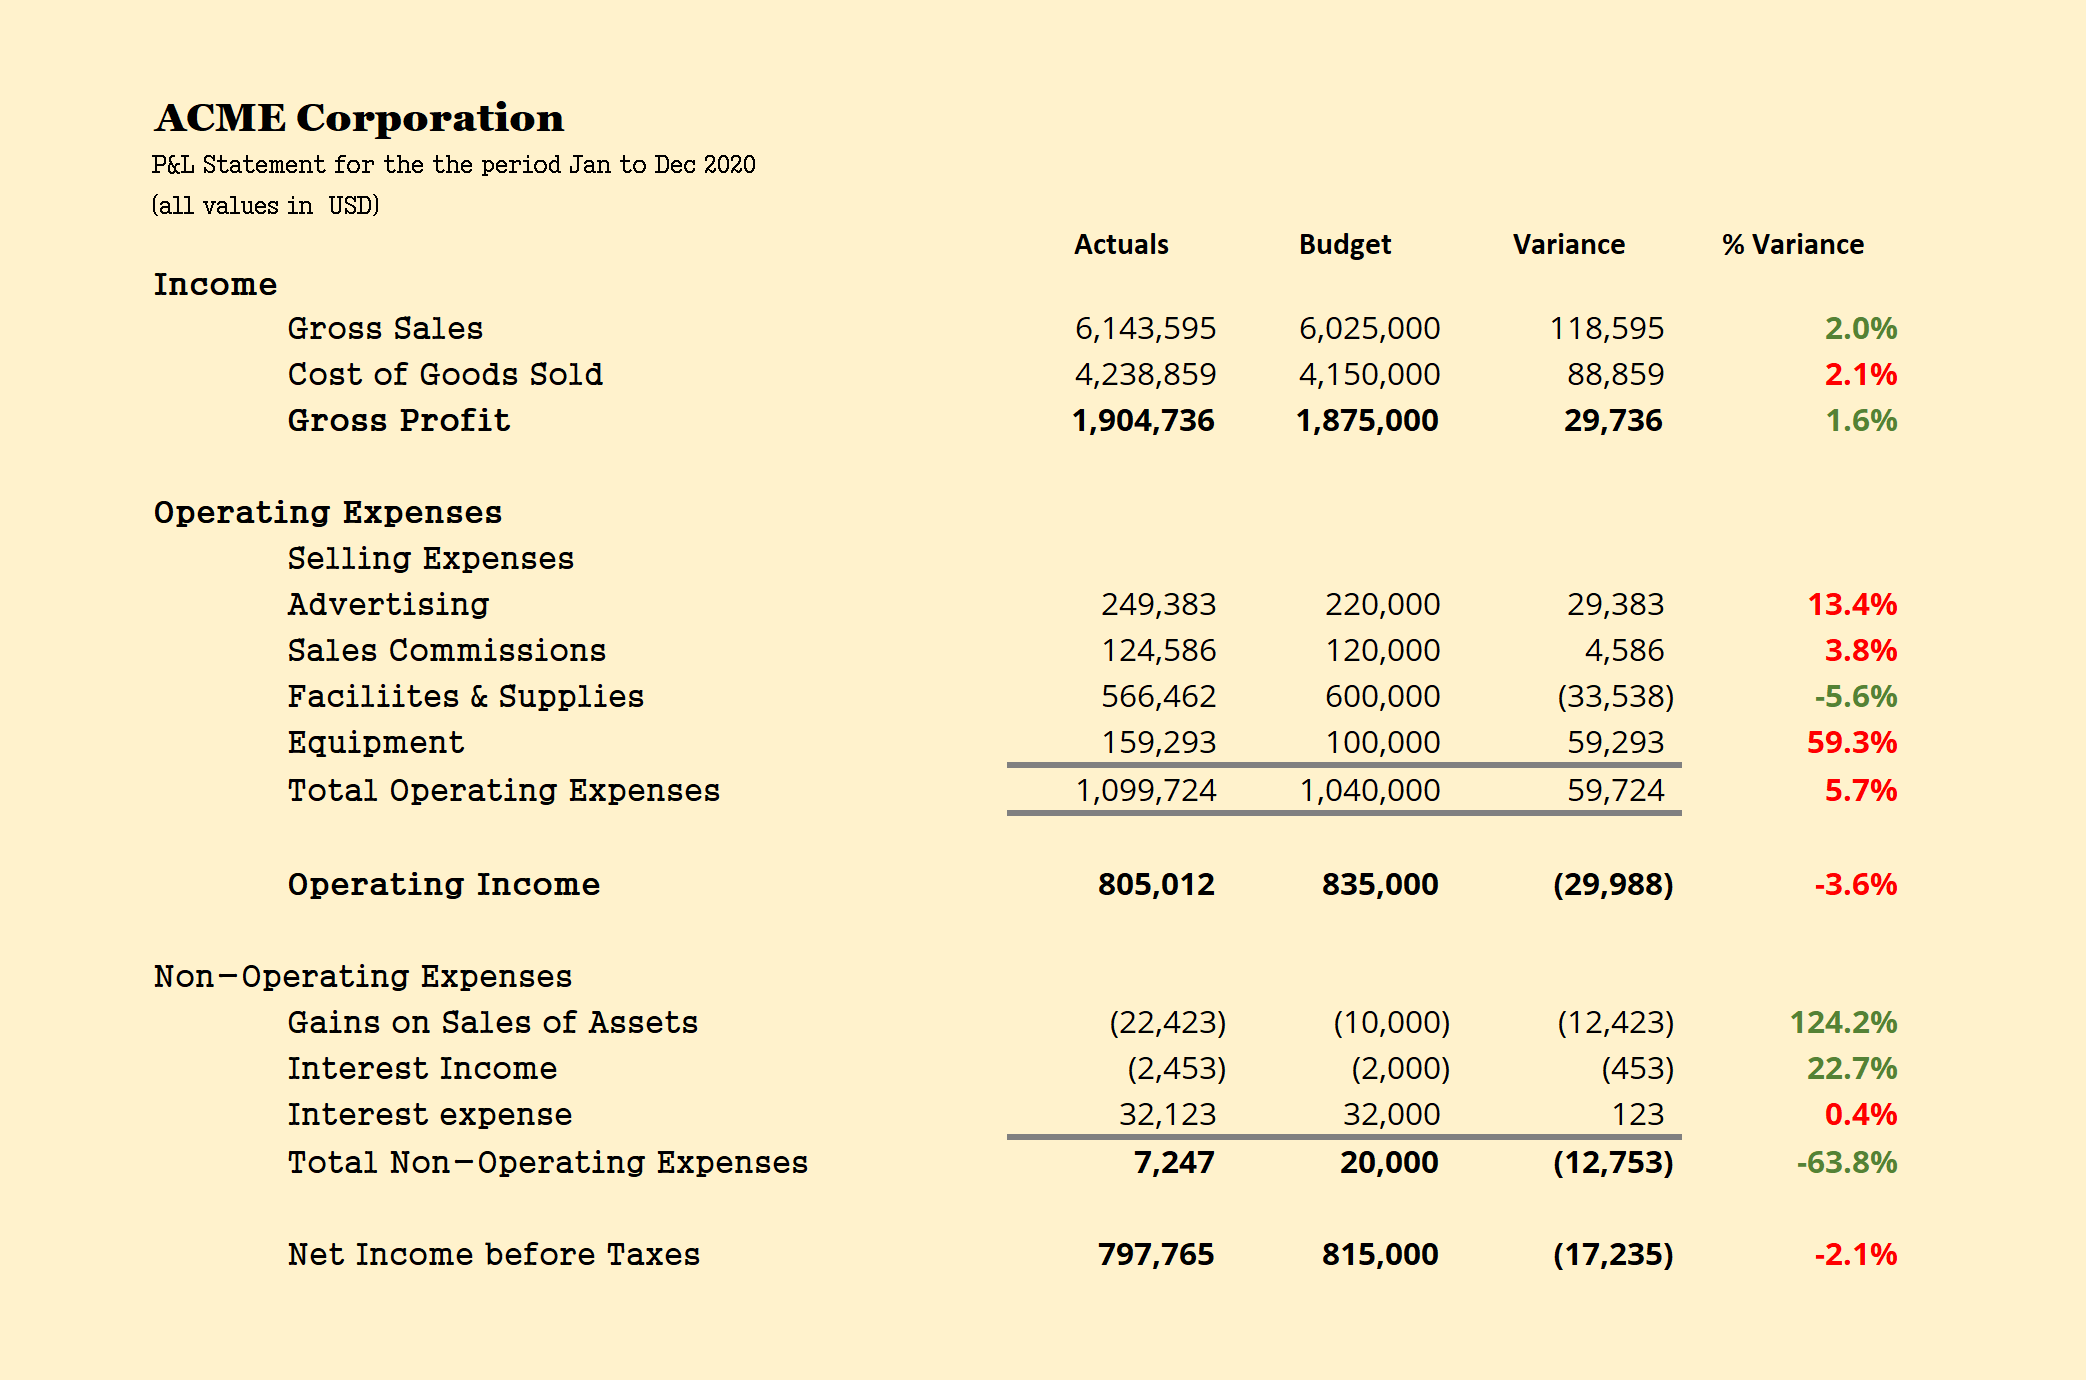
5. Variance P&L Statement
The Variance Profit & Loss Statement showcases performance against a specific benchmark. This benchmark could be a plan or a budget (used for internal reporting), or the prior period performance.
You may also see a variation of this statement in investor presentations as shown in the example below.
6. Contribution Margin P&L Statement
The Contribution Margin P&L Statement is used to showcase profit contributions from various geographies, products, or business units. This template is used for internal reporting purposes.

7. Driver-based P&L Statement

The Driver-based Profit & Loss Statement is a favorite of management and strategy consultants. It is a forward-looking template that is often used for planning in industries such as mining. Instead of breaking down revenue and expenses into constituent GL account items, the critical value drivers of the businesses are shown.
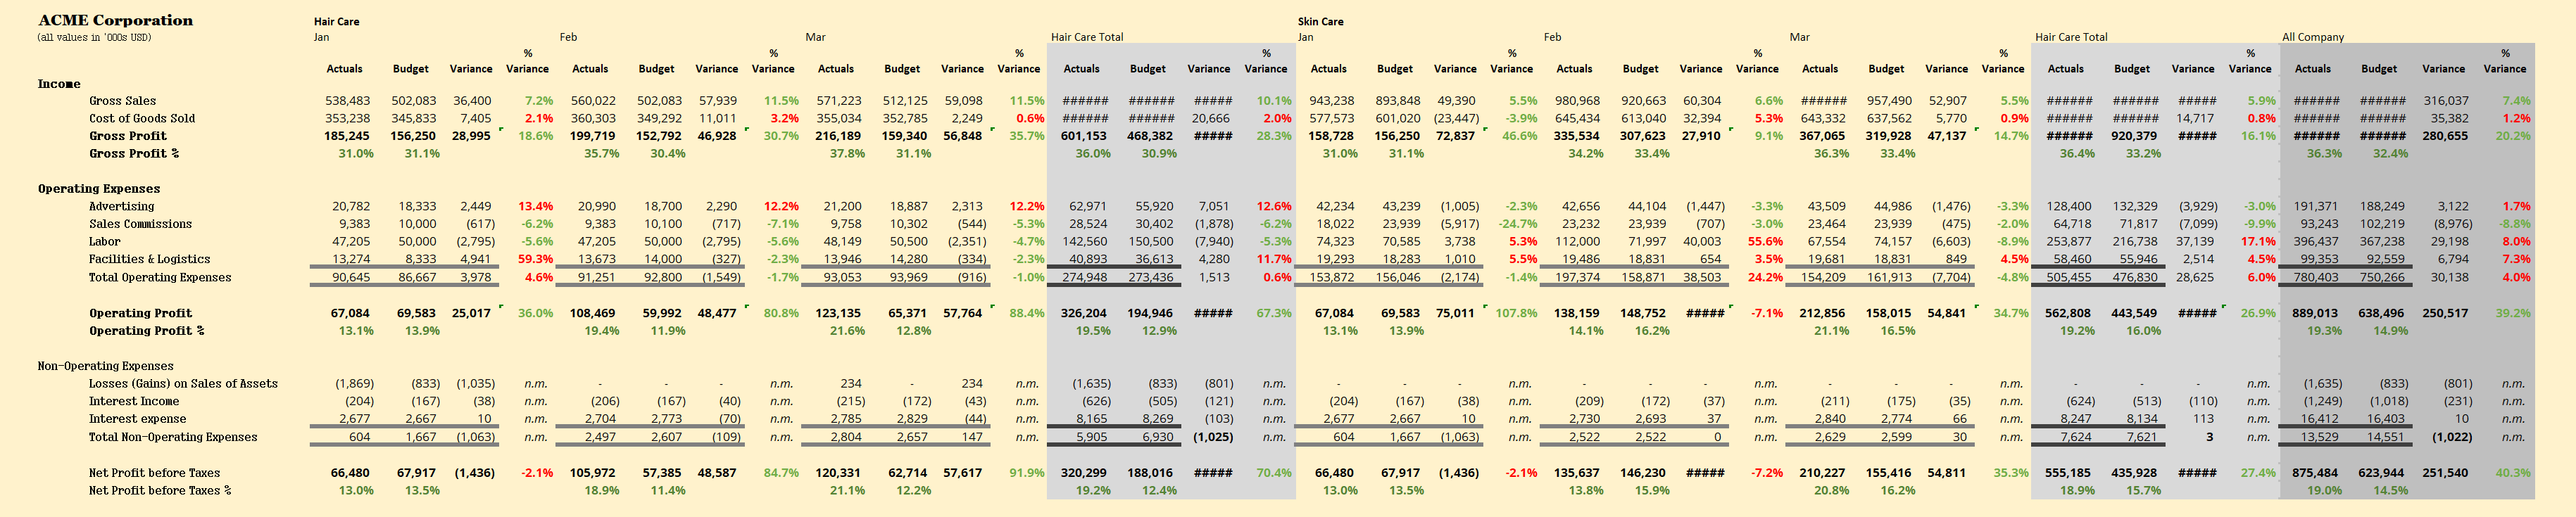
8. Composite P&L Statement
The Composite P&L Statement is a type of its own. It rules the world of Excel and enterprise reporting and variations are used by finance analysts to drive effective decisions.
There is no single template for this type. Instead, you will see is a mix of several items thrown together, such as:
- Performance & variance tracked across several periods
- Column-level grand totals and totals
- Hierarchies in columns listing products or regions
- Row-level GL accounts leveraging hierarchies to drill down to several levels (not shown in illustration)
- A mix of financial & non-financial metrics (such as # of employees, production hours etc.) thrown in for reference
- References to other spreadsheet models
- … and more
* * *
For more related content , click here .
ValQ is Visual BI’s solution for business modeling. It delivers your complex FP&A solutions of budgeting, forecasting , simulations, plans & analyses on Power BI in a visual and an intuitive manner. Try ValQ for free here.


