
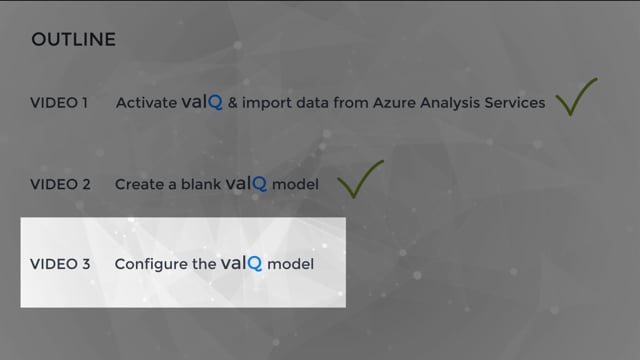
In this blog, we will be learning how to build an income statement model in ValQ from scratch in less than 60 minutes. It involves three steps as follows:
- Activate ValQ & import data
- Create a blank ValQ model
- Configure the ValQ model
Video tutorials are also attached for each of the three stages.
1. Activate ValQ & import data
a) We are going to use the sample dataset available here where we have budget & forecast data from Jan 2019 through Dec 2019 for various accounts like Goods, Services etc.
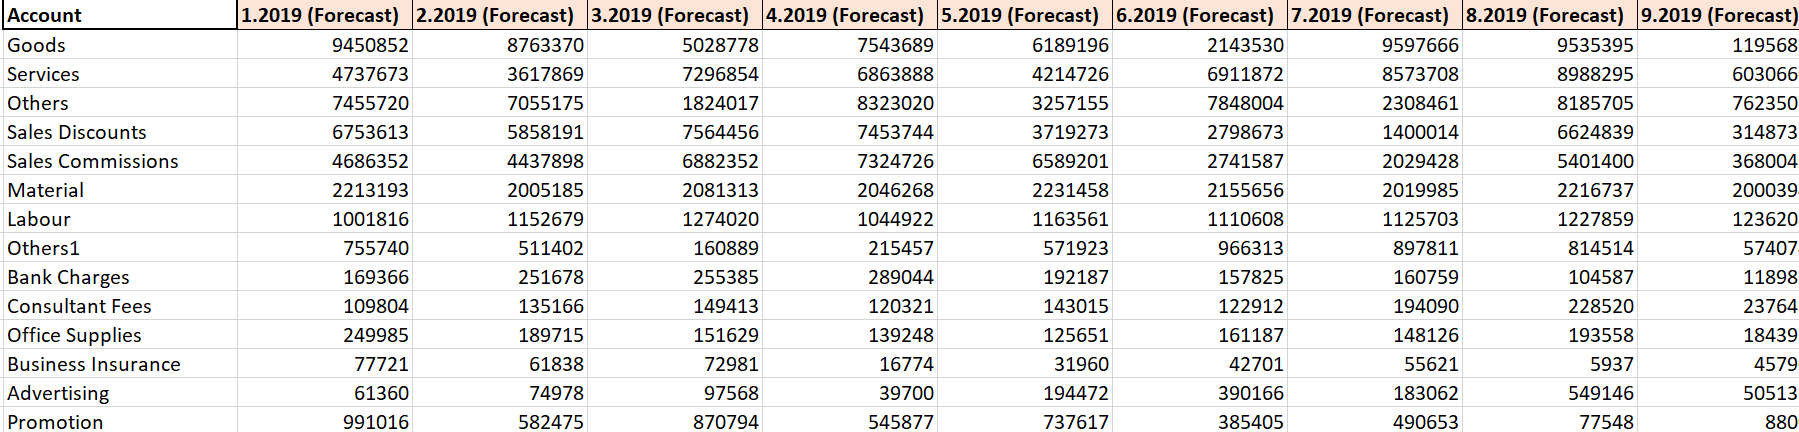
Note that we have used the same data in columnar format in the attached video.
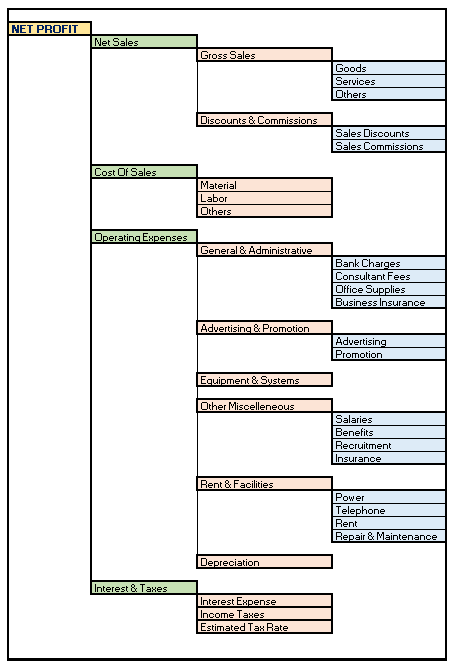
b) We will be creating the following income statement structure in ValQ.
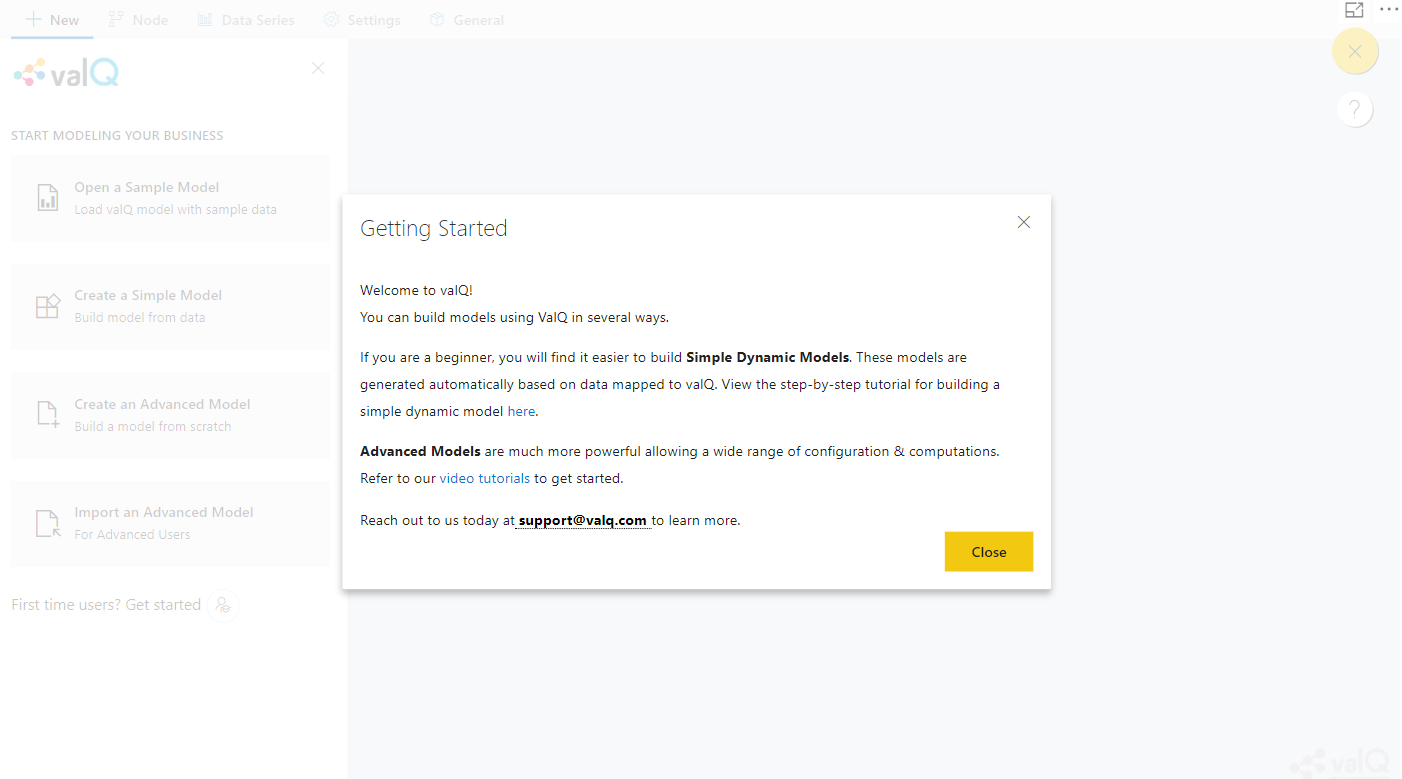
c) Import the dataset into Microsoft Power BI. Activate ValQ & you will see the following:
d) Create an advanced model by assigning the properties to Value & Category as shown:
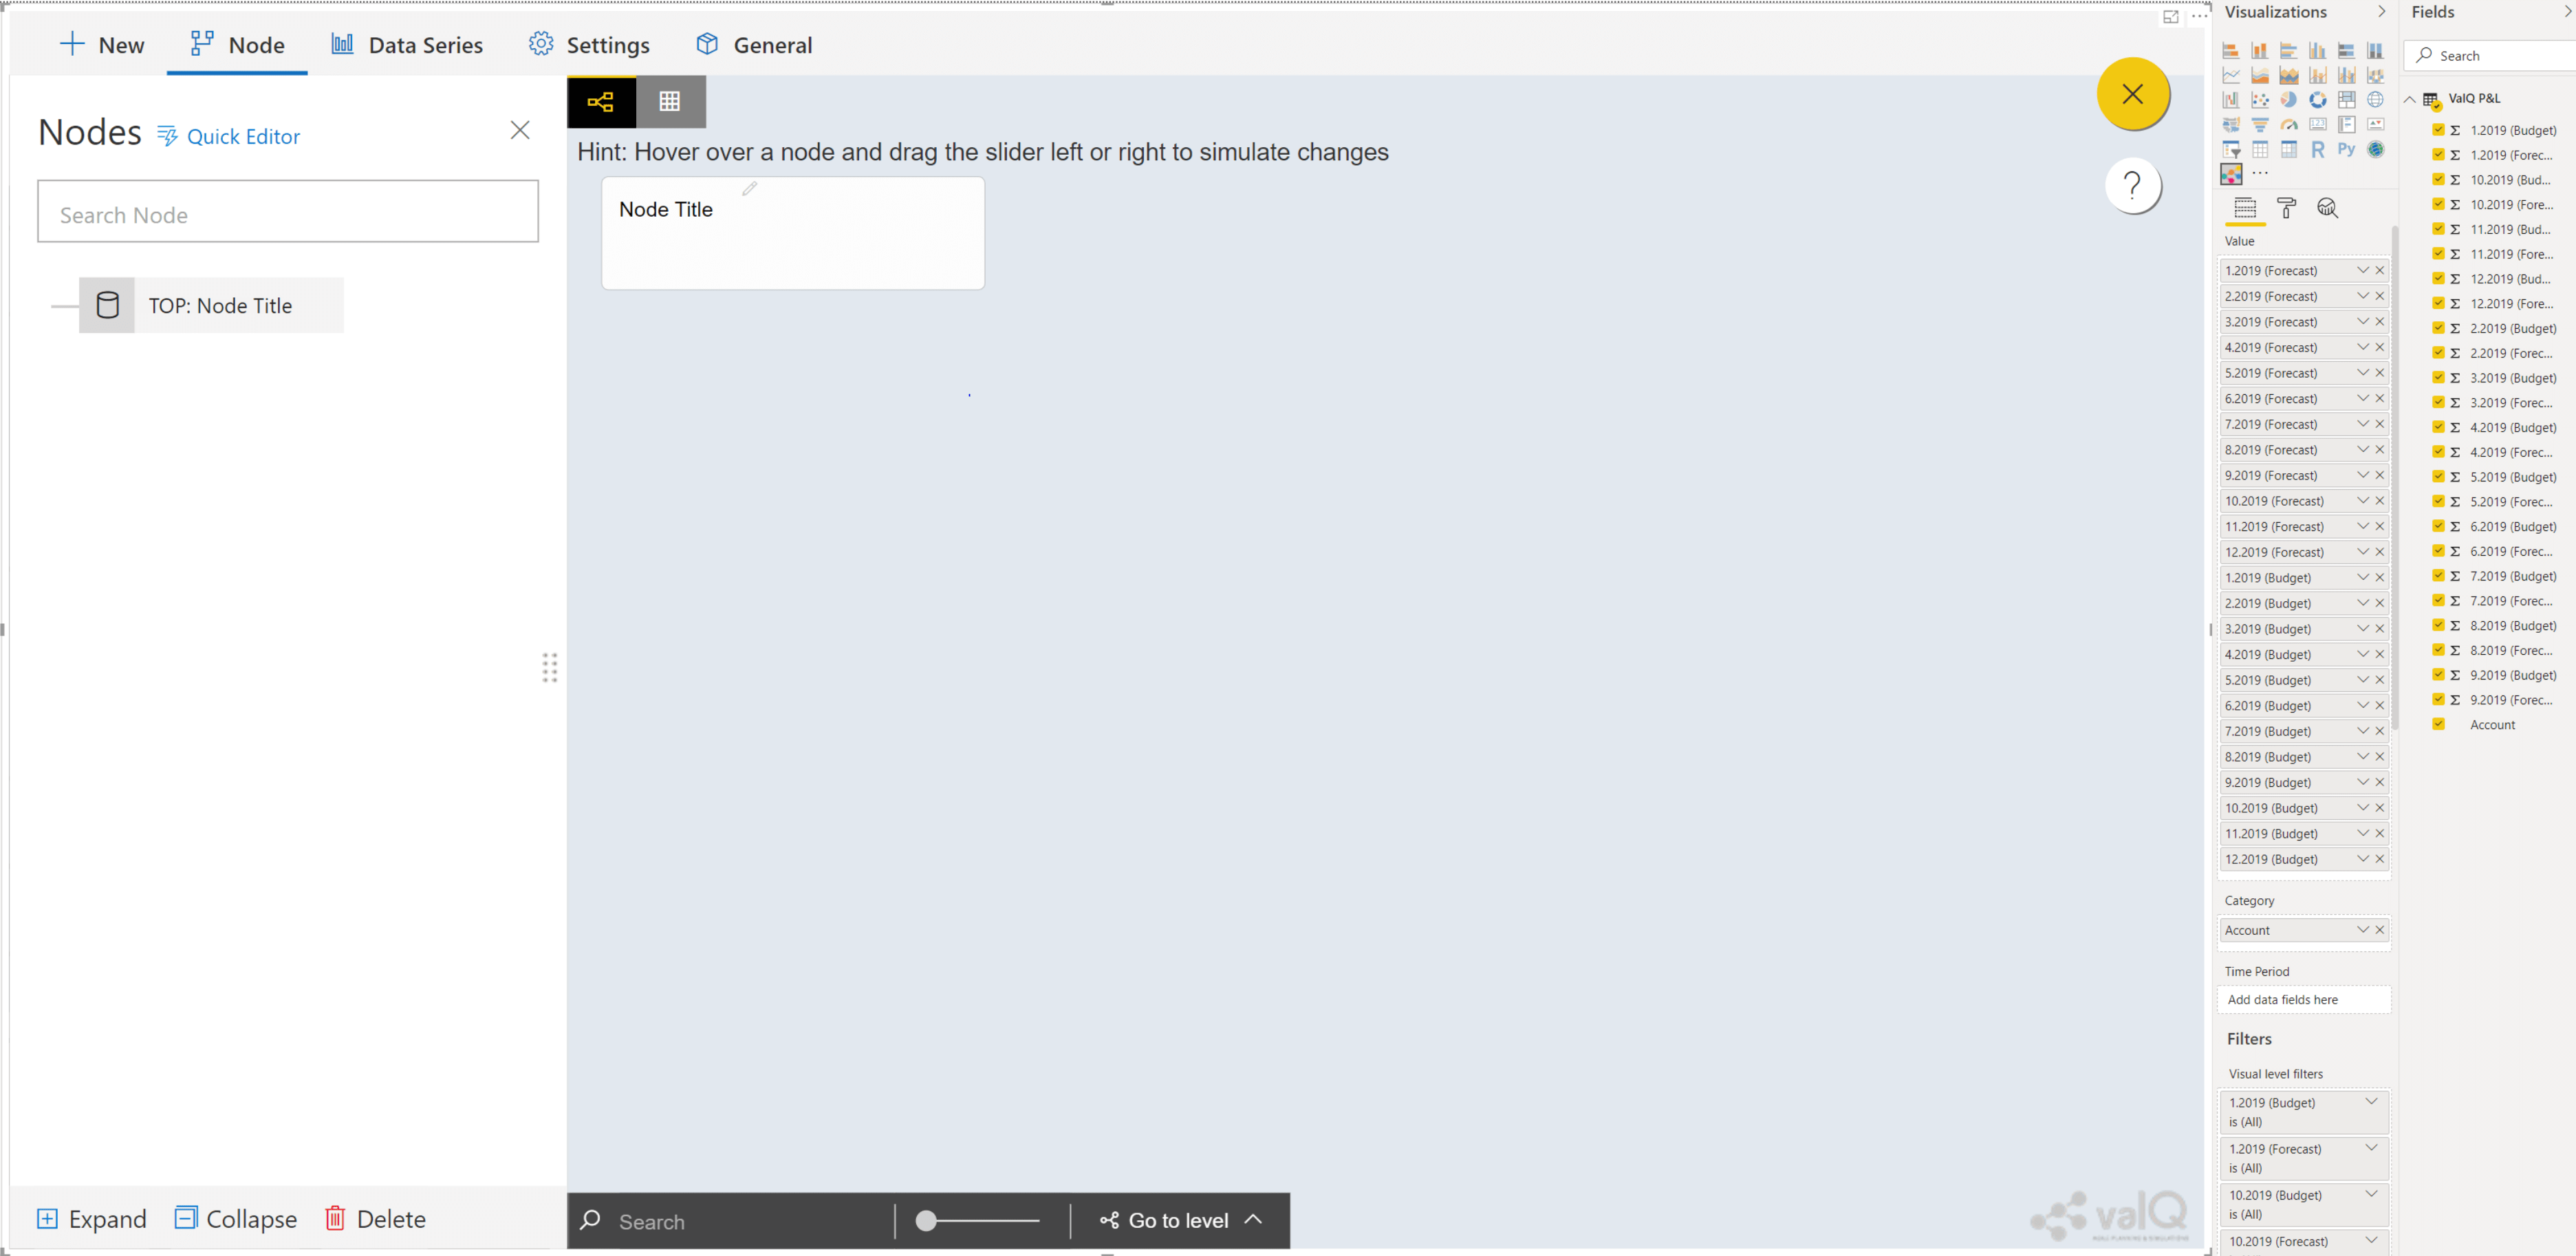
Note that if you are using columnar data, you will need to assign the properties to Time Period field too.
e) You have now successfully activated ValQ and imported the dataset.
Next, we will see how to create a blank ValQ model for the income statement as shown in Step (b).
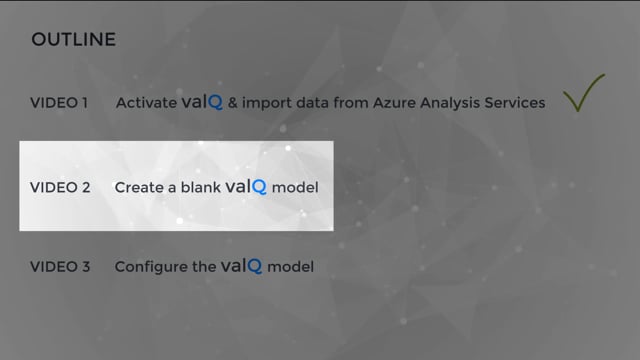
2. Create a blank ValQ model
In this blog, we will be learning how to build an income statement model in ValQ from scratch in less than 60 minutes. It involves three steps as follows:
- Activate ValQ & import data
- Create a blank ValQ model
- Configure the ValQ model
Video tutorials are also attached for each of the three stages.
1. Activate ValQ & import data
a) We are going to use the sample dataset available here where we have budget & forecast data from Jan 2019 through Dec 2019 for various accounts like Goods, Services etc.

Note that we have used the same data in columnar format in the attached video.
b) We will be creating the following income statement structure in ValQ.

c) Import the dataset into Microsoft Power BI. Activate ValQ & you will see the following:

d) Create an advanced model by assigning the properties to Value & Category as shown:

Note that if you are using columnar data, you will need to assign the properties to Time Period field too.
e) You have now successfully activated ValQ and imported the dataset.

Next, we will see how to create a blank ValQ model for the income statement as shown in Step (b).
2. Create a blank ValQ model
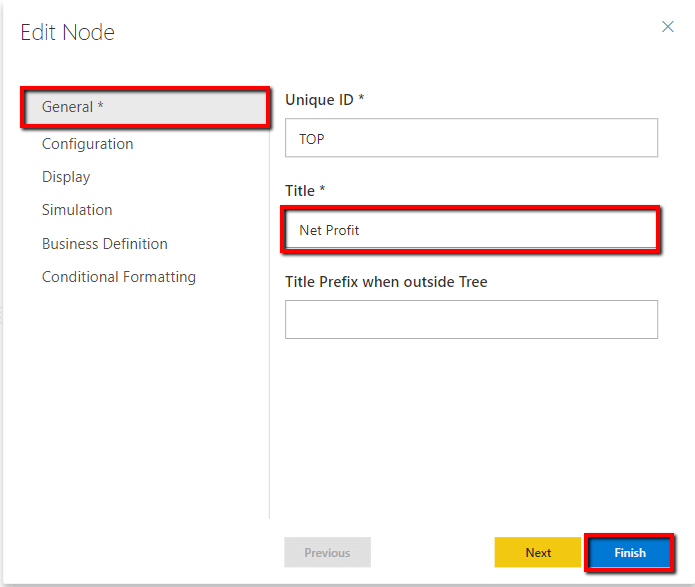
f) Navigate to the ‘Node’ hierarchy & double click on the node or click on the pencil icon next to the node to begin with the configuration.

g) ‘Edit Node’ screen will open as shown below. In ‘General’ tab, modify the ‘Title’ field to ‘Net Profit’. Once done, click ‘Finish’.
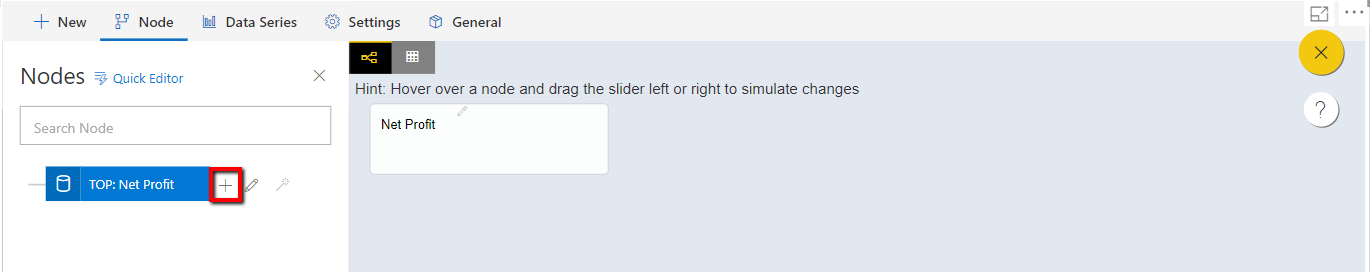
h) You will be able to see the renamed node both in ‘Node’ hierarchy and canvas. To add the child nodes, click on ‘+’ icon reflecting against the immediate parent node.
i) Rename the child node to ‘Net Sales’ by following the steps (f) & (g).

j) Similarly, as per steps (h) & (i), continue creating the child nodes. The result would be a blank ValQ model as shown below:
Next, we’ll see how to configure the nodes in ValQ.
3. Configure the ValQ model
In this section, we will be configuring the nodes built in ValQ. We will be updating the fields in the Edit Node screen for the nodes in tabs: Configuration, Display & Simulation.
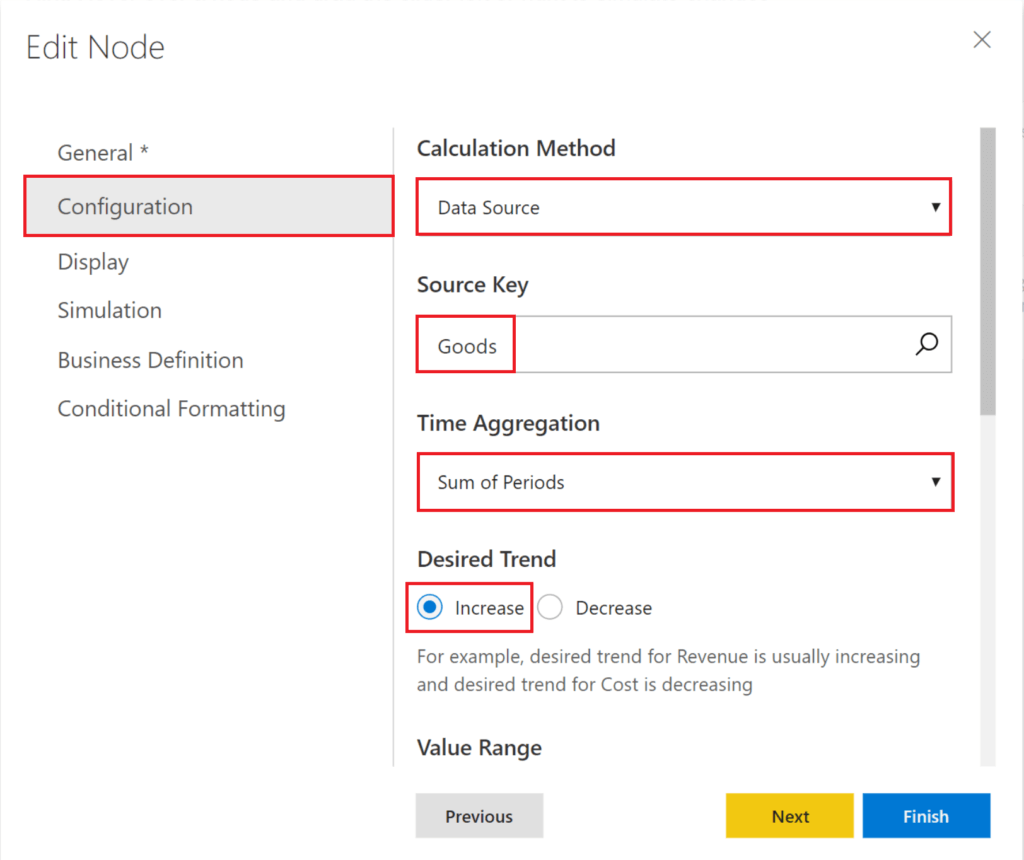
k) Double click on the node, ‘Goods’. In the Edit Node screen, navigate to ‘Configuration’ tab & fill the fields ‘Calculation Method’ (Data Source or Sum Children or Formula etc.), ‘Source Key’, ‘Time Aggregation’ (Sum of Periods or Average or Formula or Cumulative etc.) & ‘Desired Trend’ (Increase or Decrease) as shown here.
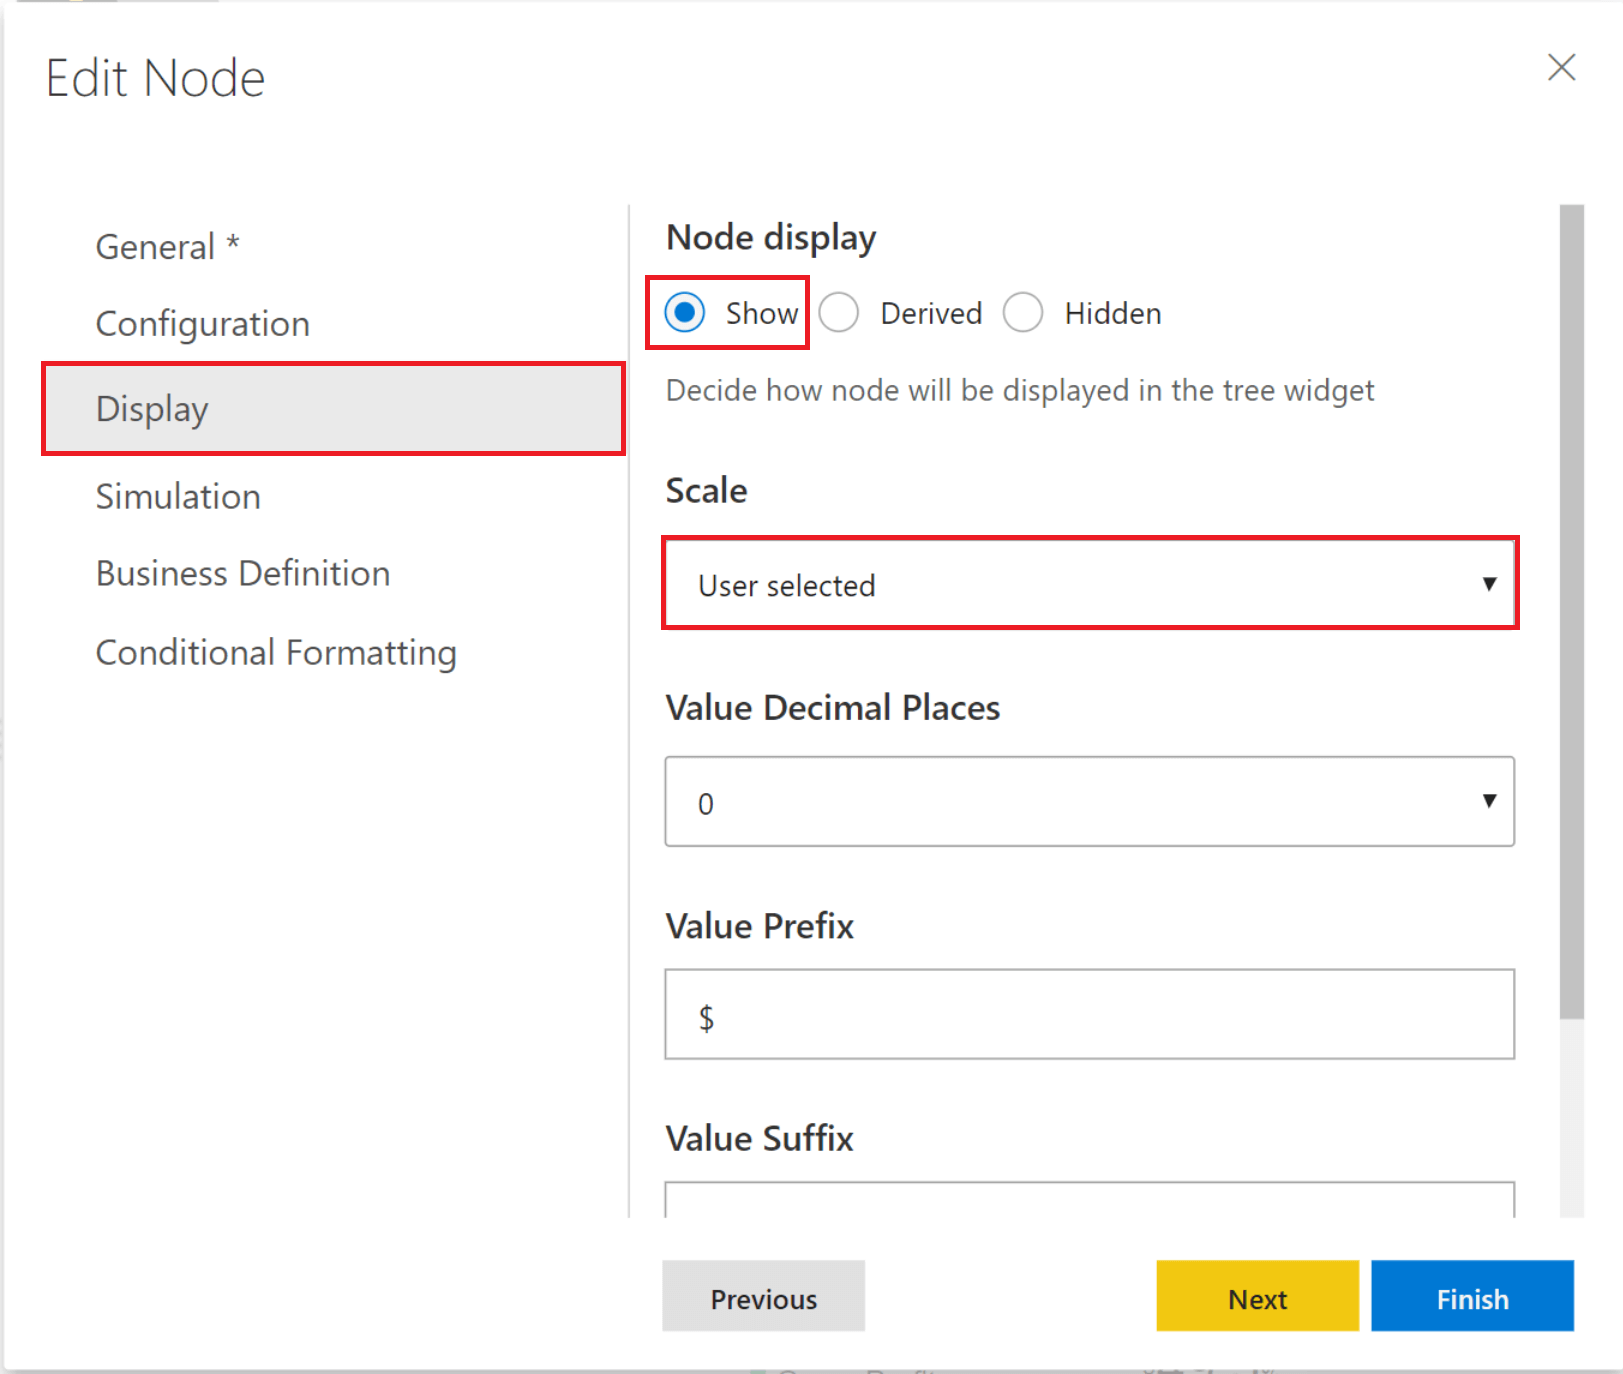
l) In Display tab, select the type of display (Show or Derived or Hidden) & ‘Scale’ (User selected or so) that you would want to opt for. You can customise the fields like ‘Value Decimal Places’, ‘Value Prefix’, ‘Value Suffix’ & ‘Details on Click’ too.
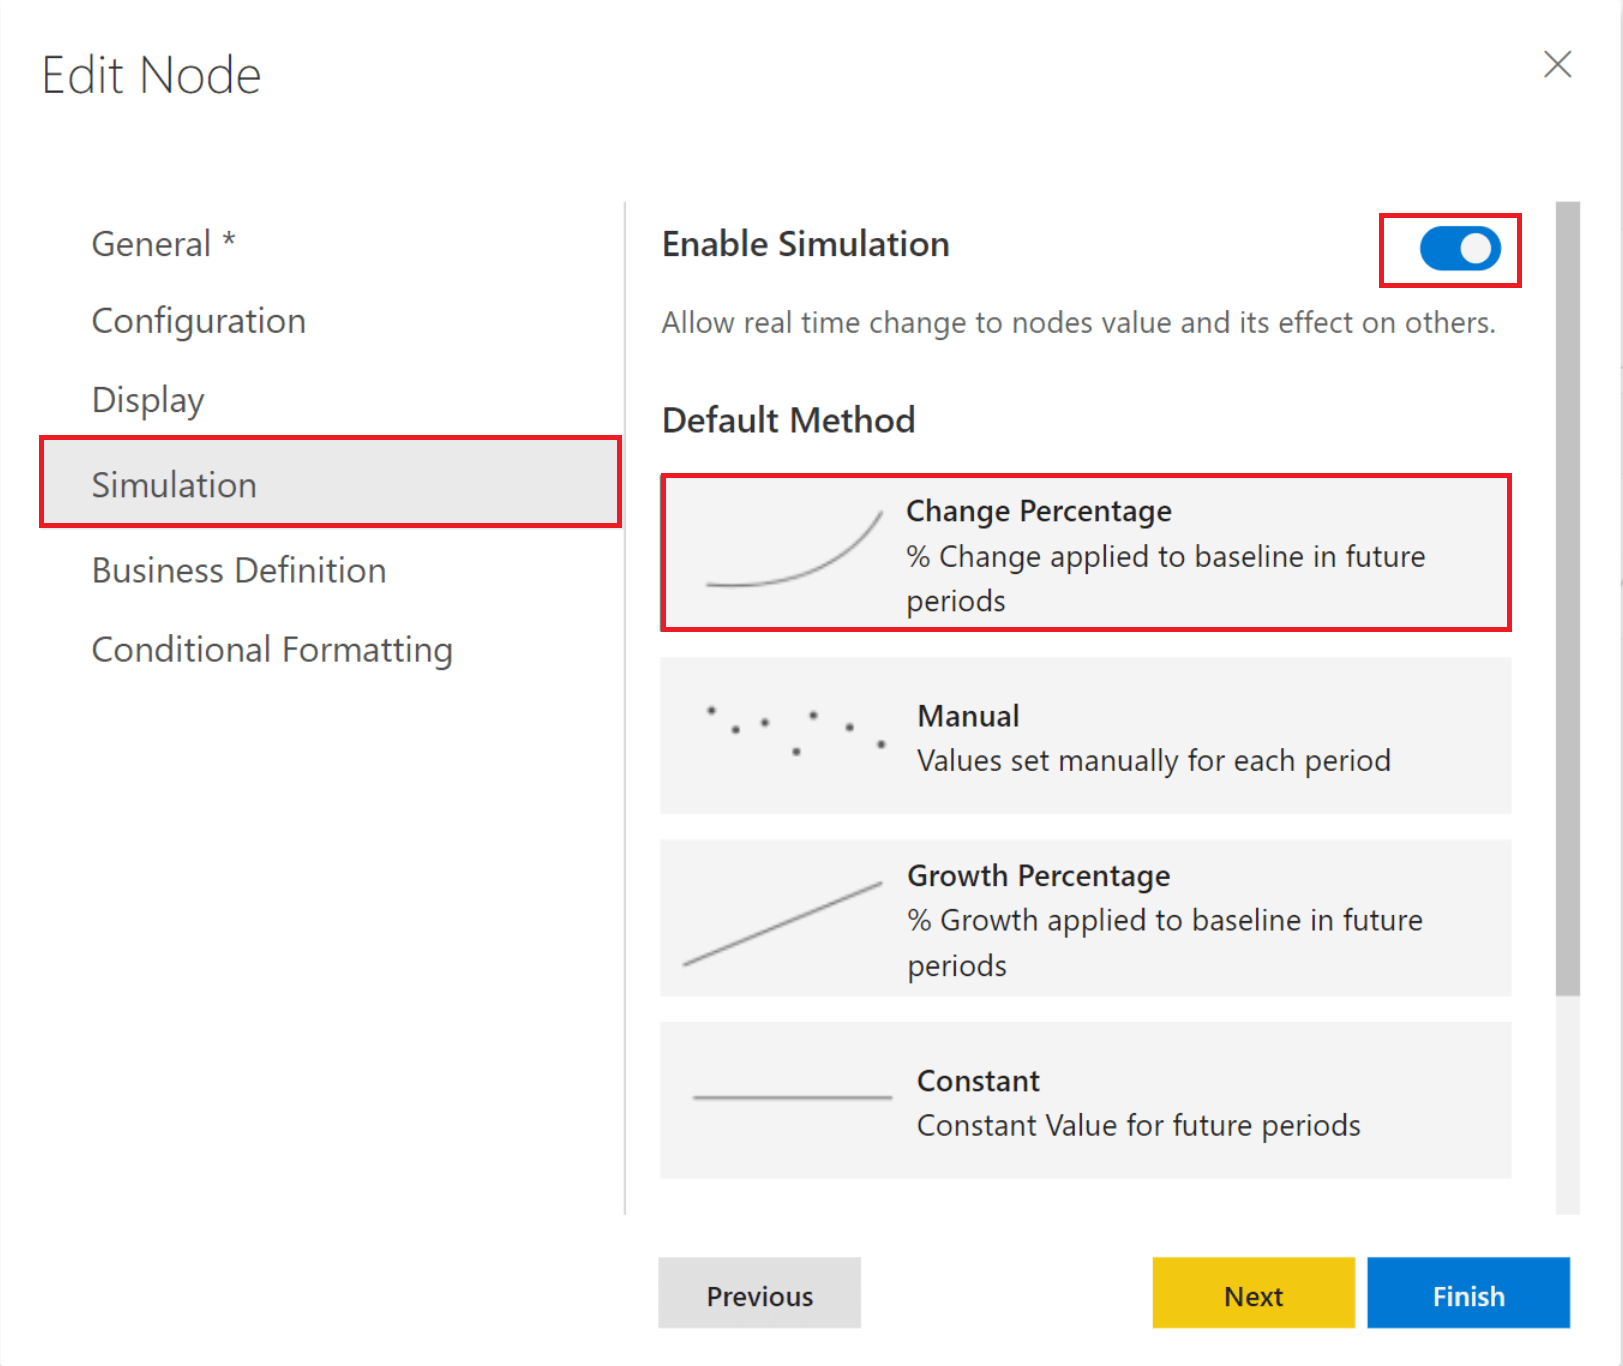
m) In Simulation tab, you can enable the simulation method (Change Percentage, Manual, Growth Percentage, Constant) as shown here.
Furthermore, in ‘Business Definition’ tab, you can add notes for node’s description, header, footer etc. To override the conditional formatting at node level, navigate to ‘Conditional Formatting’ tab.
Similarly, as you complete the configuration of all the nodes, the result would be an income statement model in ValQ as shown here.
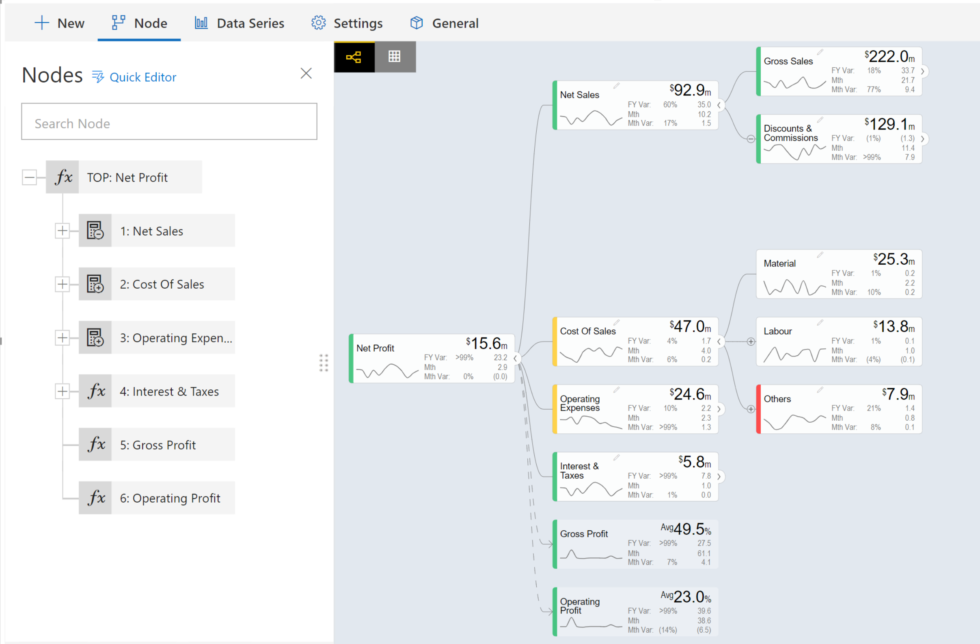
With this, you have successfully learned how to build an Income Statement model in ValQ.
To learn more, tune into one of our ValQ Webinars.
Download the latest version here and get started with ValQ Collaborate Edition today.


