
The latest ValQ release is packed with several new features. We have the widely requested features – attribution analysis, rolling forecasts, table view by periods and enhancements in writeback, export as data source and more. In addition, there are several formula enhancements and performance fixes.
Let us look at the updates and enhancements.
New features
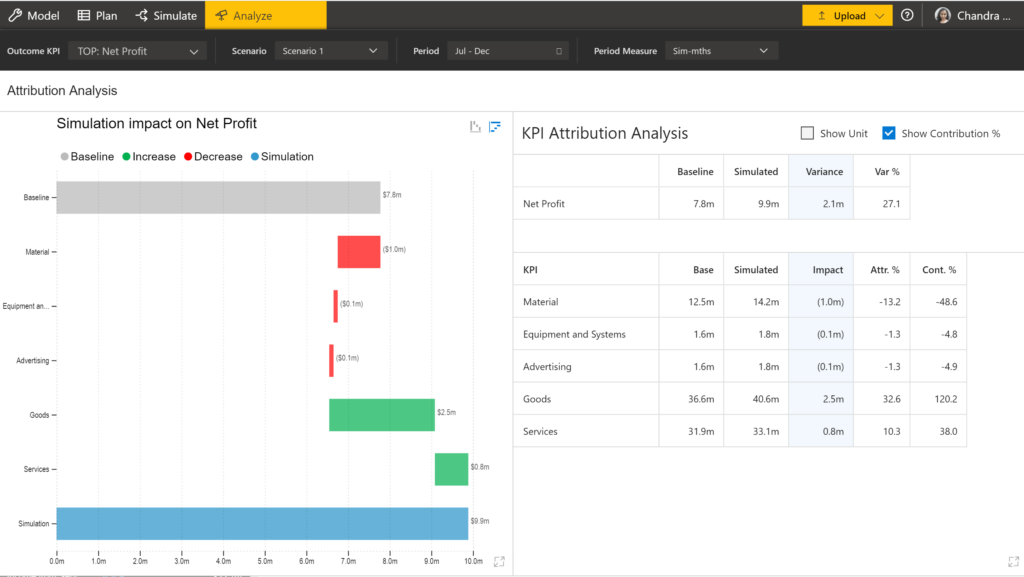
1. Attribution Analysis
It is now possible to analyze the contribution of different key performance indicators and key inputs to the simulated results of an outcome using attribution analysis. In the below example, you can see the waterfall chart in the right which shows how the $2.1 million increase in Net Profit is attributed to Goods, Services, Advertising etc. The same information is also presented in the table on the right, along with the attribution and contribution percentages.
Stay tuned for more updates in the Analyze tab in the upcoming versions.
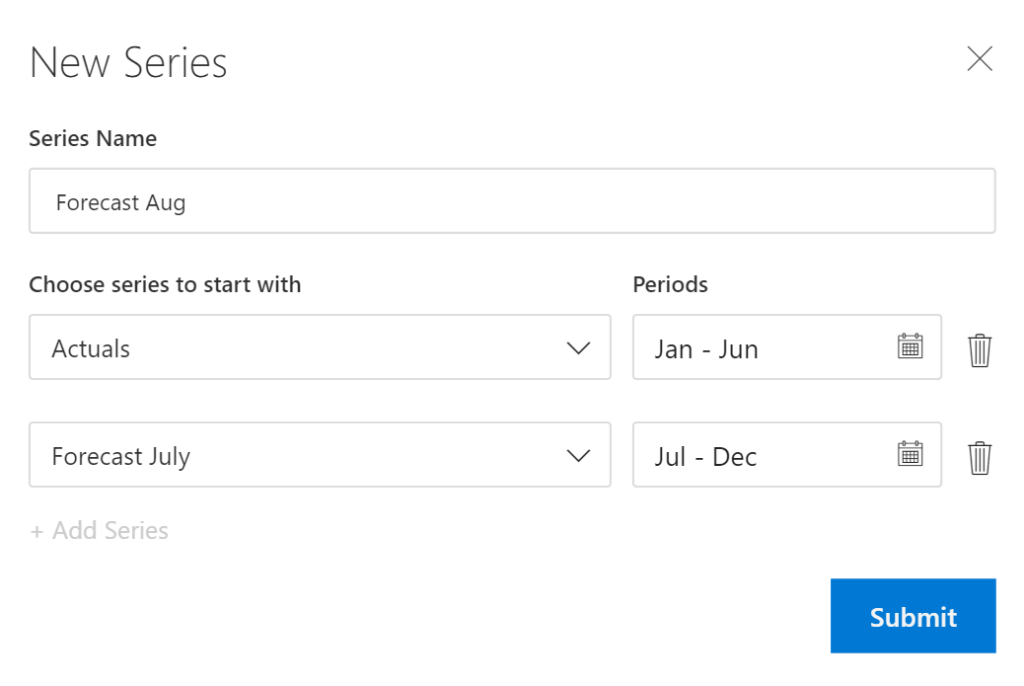
2. Rolling Forecast
Using rolling forecasts, you can accommodate recent trends to your forecasts over a set time frame. The prediction is based on rolling out each recent period value and re-forecasting for the entire period.
This can be done by choosing your actuals from a base series and forecast from the recent series as shown below.
3. Table View by periods
Table view can now be customized to show a period view in addition to the summary view.
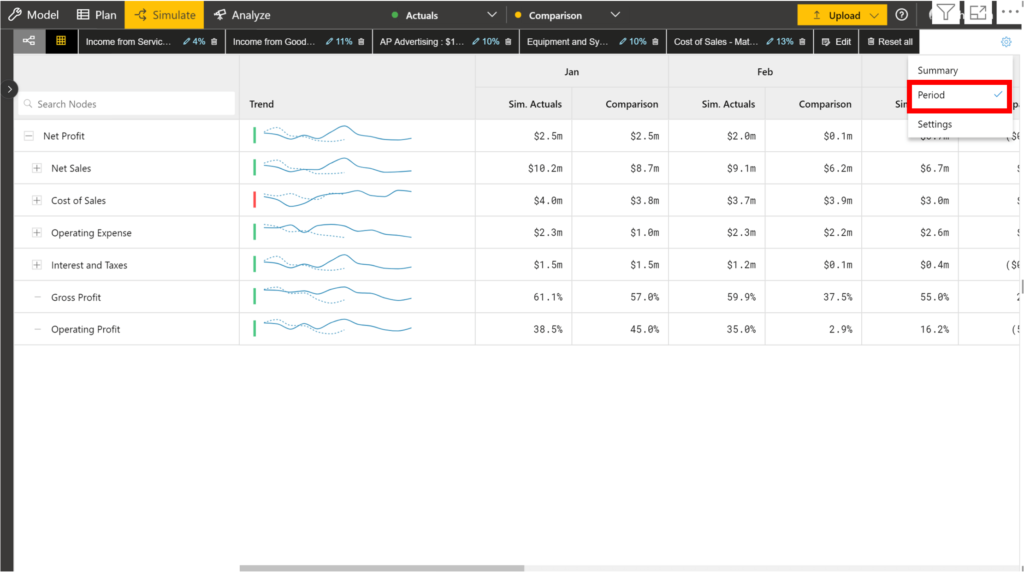
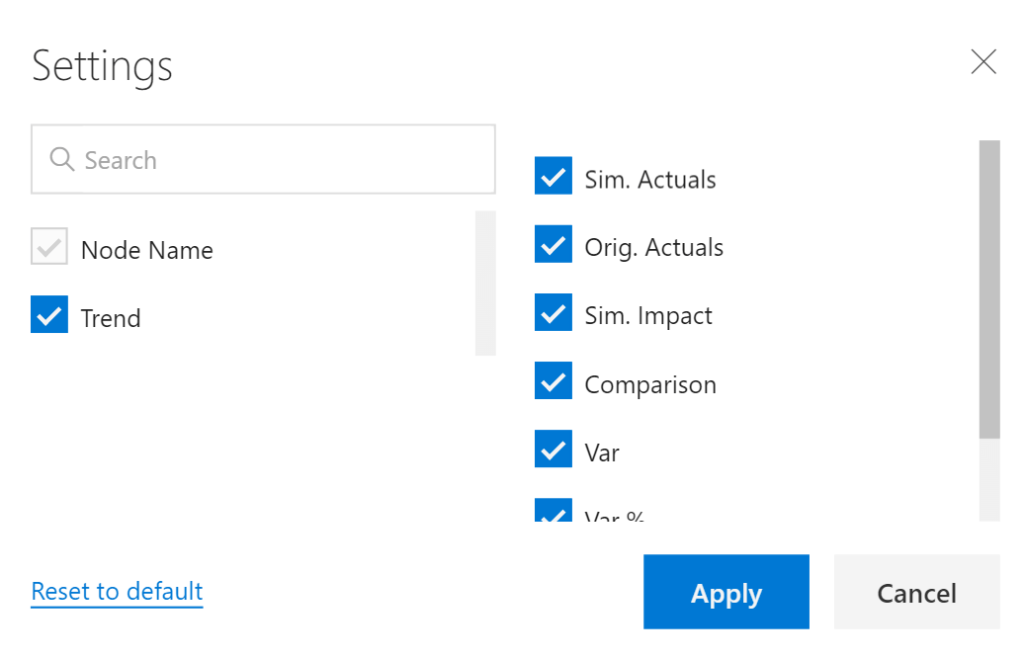
The columns to be displayed can also be chosen from the settings as shown below.
ValQ Enhancements
1. Variance Analysis
It is now possible to perform variance analysis for more than two data series including scenarios. The baseline and comparison selection in the toolbar have been enhanced for ease of understanding.
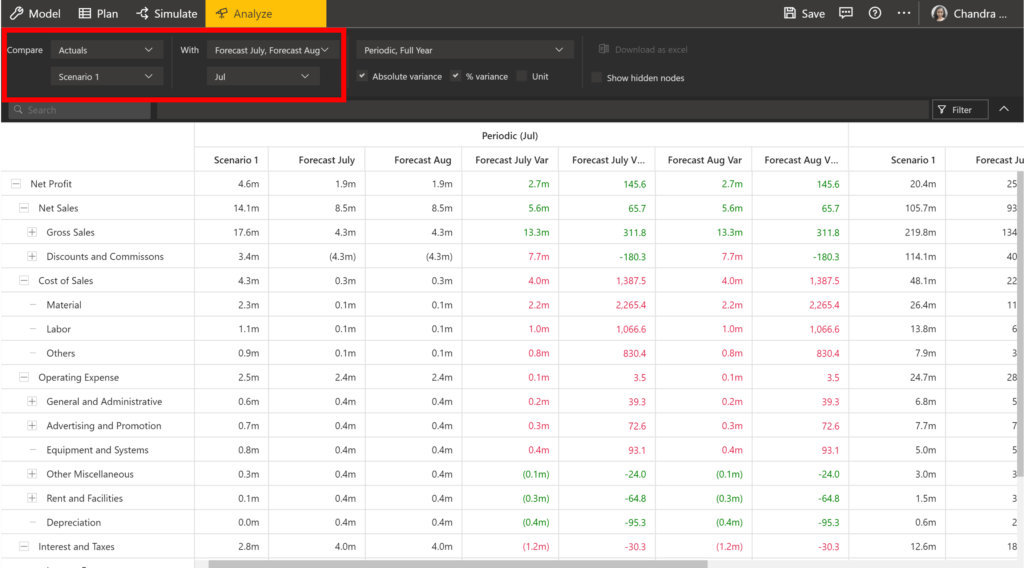
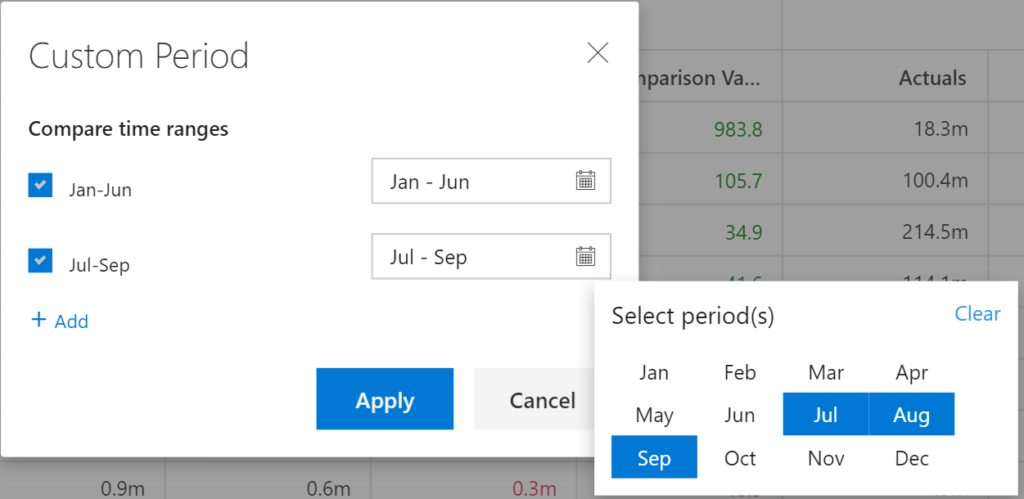
Custom period selection has been introduced along with the available in-built options.
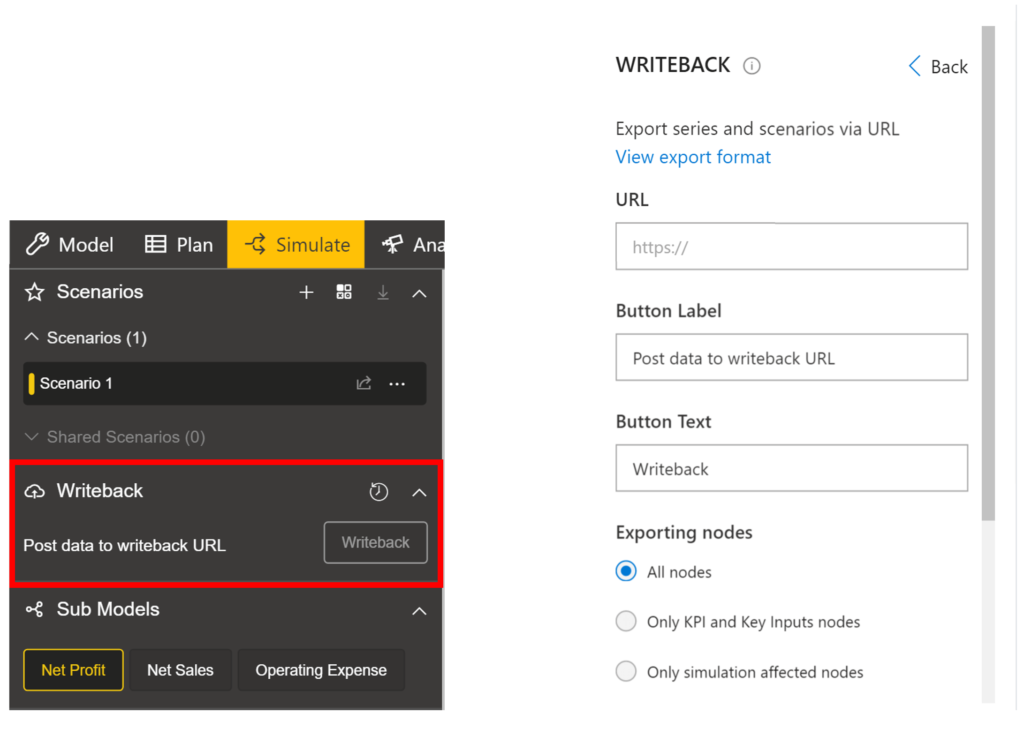
2. Writeback
Writeback allows you to export the scenarios and data series to your backend systems. It can now be accessed during run time along with an option to view the writeback history from the Navigation Panel.
While configuring the settings, there is an additional option that lets you decide whether to export only KPIs and Key Input nodes or Simulation affected nodes. The export format has been enhanced to include user details, node level comments and more.
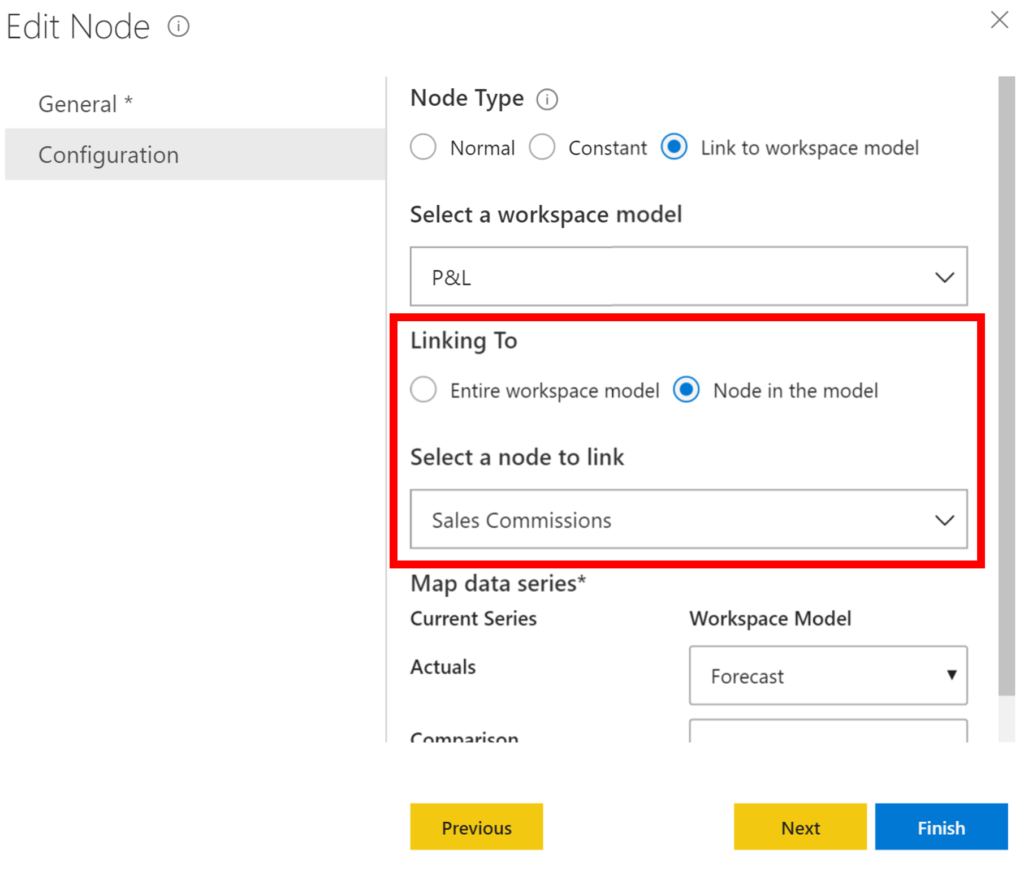
3. Model Merge
The ‘Node in the model’ option can be used to connect to selected node in the same model. To learn more about linking entire workspace models, read the blog Merging Models in ValQ.
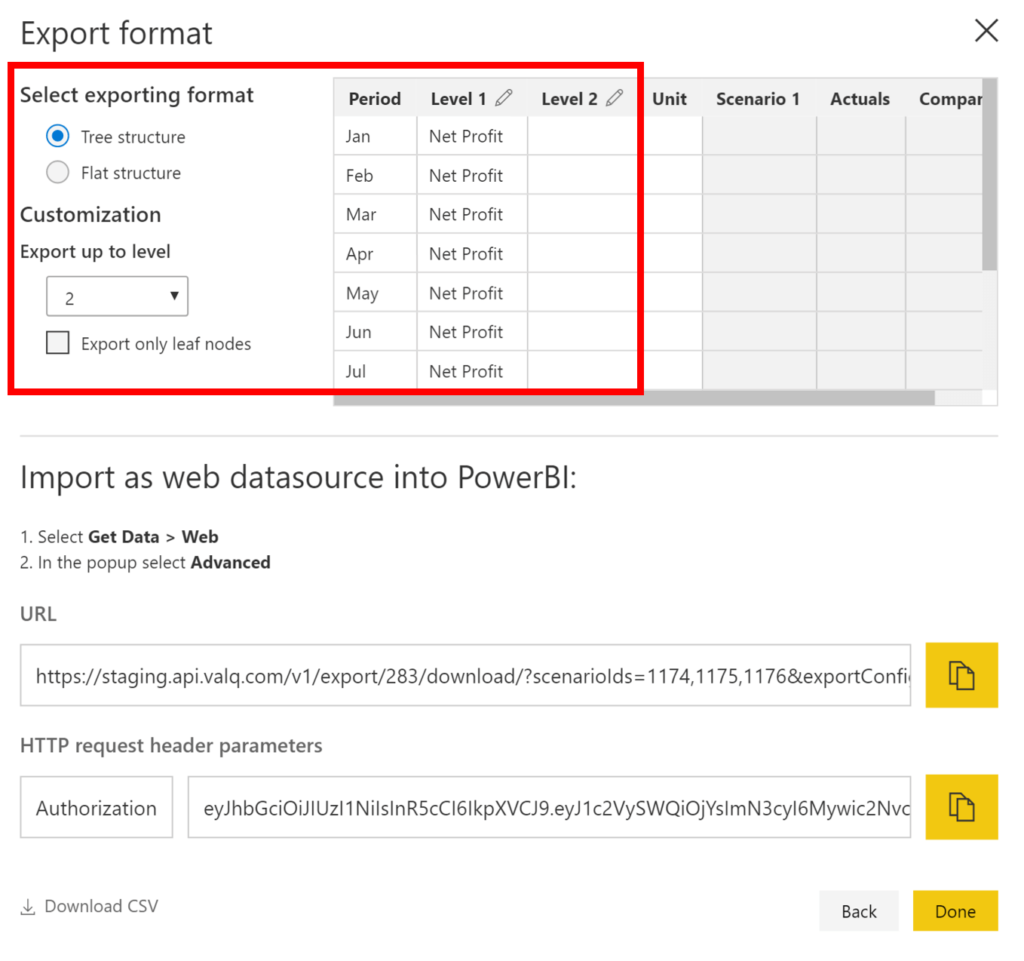
4. Export as datasource
You can perform the following while exporting your ValQ model as a datasource:
- Choose the Export format as either a ‘Tree structure’ or ‘Flat structure’
- Customize the Export level of the nodes
- Edit and rename the column names by clicking on the editor icon
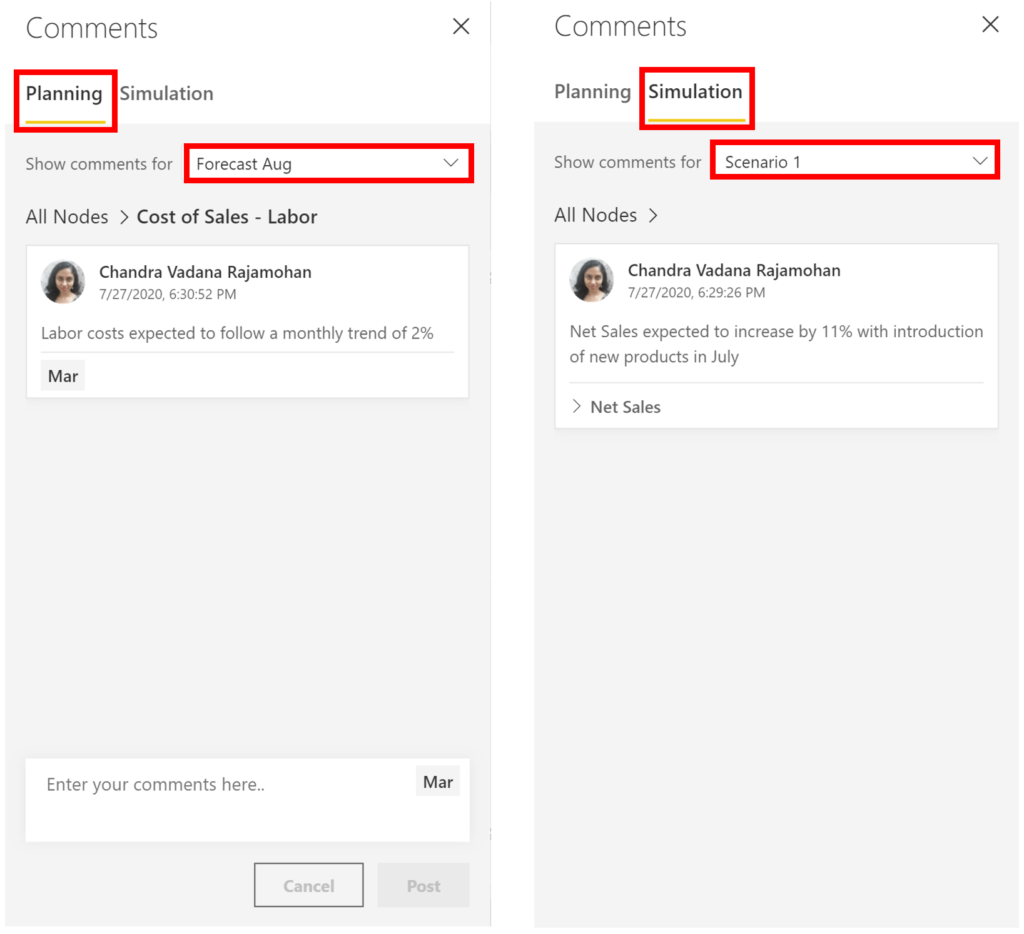
5. Comments and Audit Log
To enhance the user experience, Notes in the Plan tab has now been consolidated with the Comments in Simulate tab. Comments by all users in the workspace in the plan series in Plan tab and scenarios in Simulate tab can be viewed as shown below.
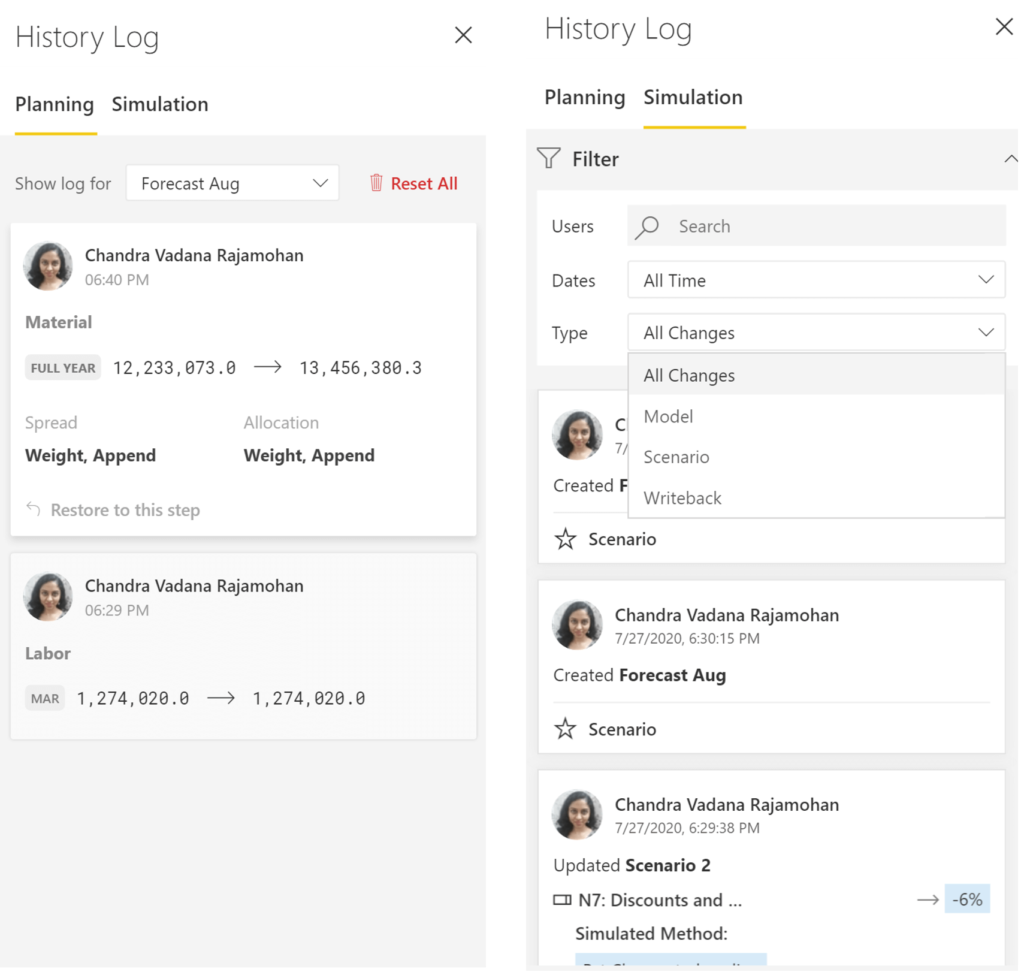
Similarly, View Allocation History in the Plan tab has now been consolidated with the History Log in Simulate tab.
6. Formulas and functions
In 1.8, a number of new functions and identifiers have been introduced. One of the most important is the ‘find by’ function, which can be used for tagging or grouping nodes.
findByTitle(string) – We can pass the name of the node or regular expression to match the node. For example: ^Sales to match all the nodes which starts with Sales or Sales$ to match all the nodes which ends with Sales.
Performance fixes
- Fetch more API issue in advanced trees with large number of nodes has been addressed.
- Time taken for saving large models which used to take more than a minute in 1.7 has been considerably reduced.
- Optimization has been done while auto saving models to detect only changes and update the storage.
Download the latest version here and get started with ValQ Collaborate Edition today.


