
In the preceding blogs, we took a quick look at the origins of Value Driver Tree and a few reasons why they are making a comeback. Let’s now take a look at some of the key business use cases for Value Driver Tree.
Note that Value Driver Tree models facilitate not only the analysis but also stakeholder discussion & communication in all these use cases.
1) Business Modeling: Simulate an executive’s view of the business through dynamic modeling; Understand how drivers impact outcomes; Evaluate business initiatives such as new product launch or new market entry; Identify opportunities for efficiency & improvement; and more.
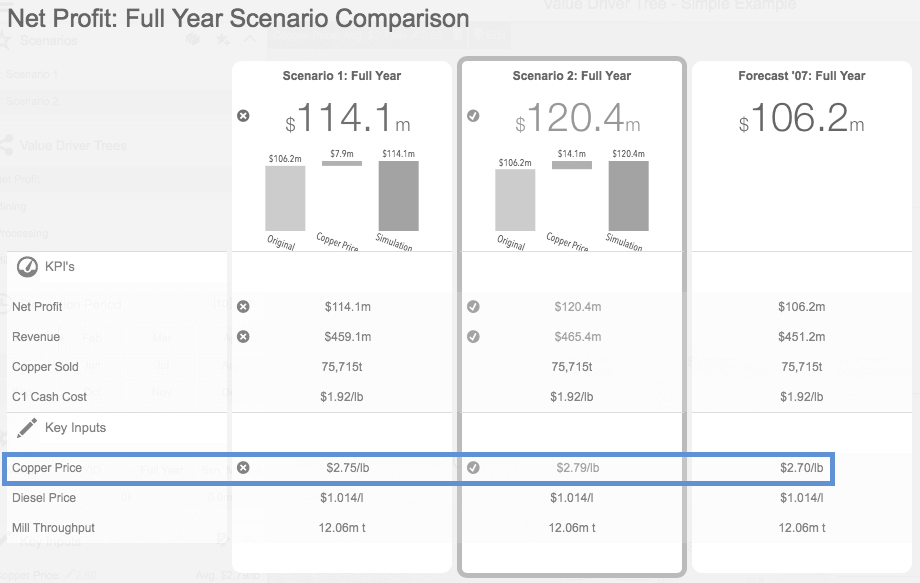
2) Strategic Target Setting: Incorporate changes to external & internal drivers and simulate fully costed scenarios based on current forecast, budget or actuals. Share justified clear targets to businesses for bottom up planning process.
3) Budgeting & Planning: Compare budget versions; Understand variations in budget drafts. Identify opportunities for cost savings by playing through unlimited scenarios rather than basic percentage cost savings.
4) Sensitivity Analysis: Understand the impact of changes to one or more value drivers to operational or financial outcomes.
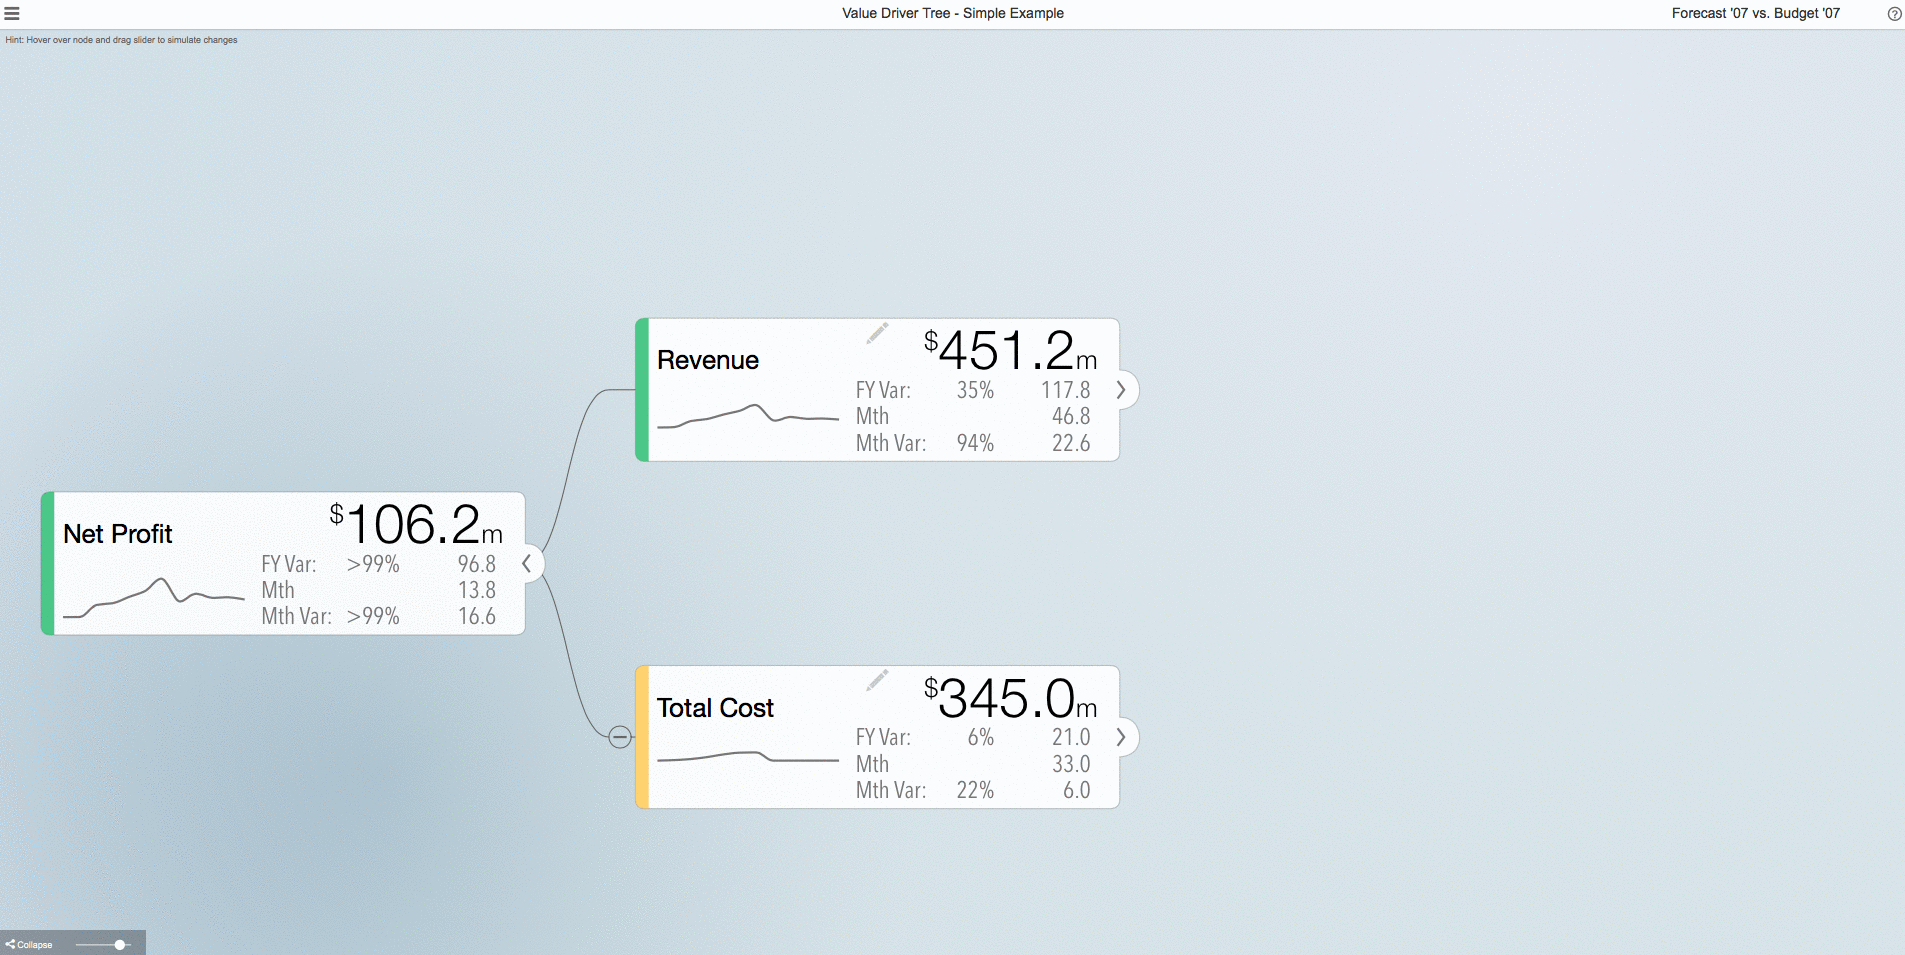
5) Periodic Reforecasting & Variance Reporting: Compare budget vs forecast. Identify root causes for variances. Play through scenarios for the rest of the year to identity remedial actions.
6) Executive KPI Dashboards: Leverage the calculation engine to calculate KPI’s. Use value driver trees to visualize and analyze performance, and drill down to the details.
* * *
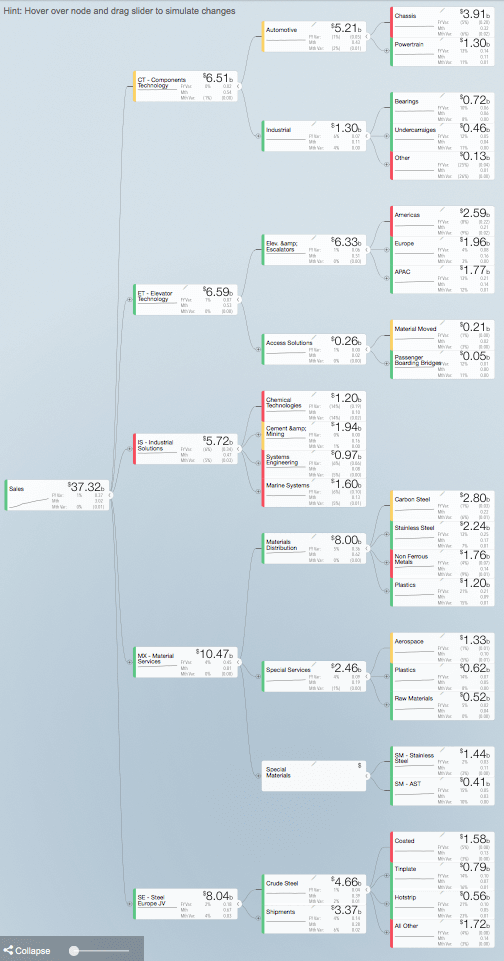
The visual shown above has been generated using Visual BI’s ValQ.
ValQ is Visual BI’s solution for business modeling. It is an innovative self-service business planning and simulation solution that lets you instantly visualize and optimize profitability & growth. ValQ is designed to enable executives, decision-makers and business analysts to seamlessly connect to data to make effective decisions. ValQ is fully customizable, mobile-compatible and has a highly engaging and intuitive interface. It is now available for SAP and Microsoft Power BI.
In our other blogs, we’ll review more topics of interest such as tips on getting the most out of value driver trees, best practices, how-to recommendations, software evaluation considerations, exciting features of ValQ and more.
To learn more, tune into one of our ValQ Webinars or try our product for free here.


