
Note: This feature is no longer available
With ValQ, it is now possible to analyse the effect of different key performance indicators and key inputs on the simulated results of an outcome using attribution analysis. In this blog, we cover the steps to perform attribution analysis with an example.
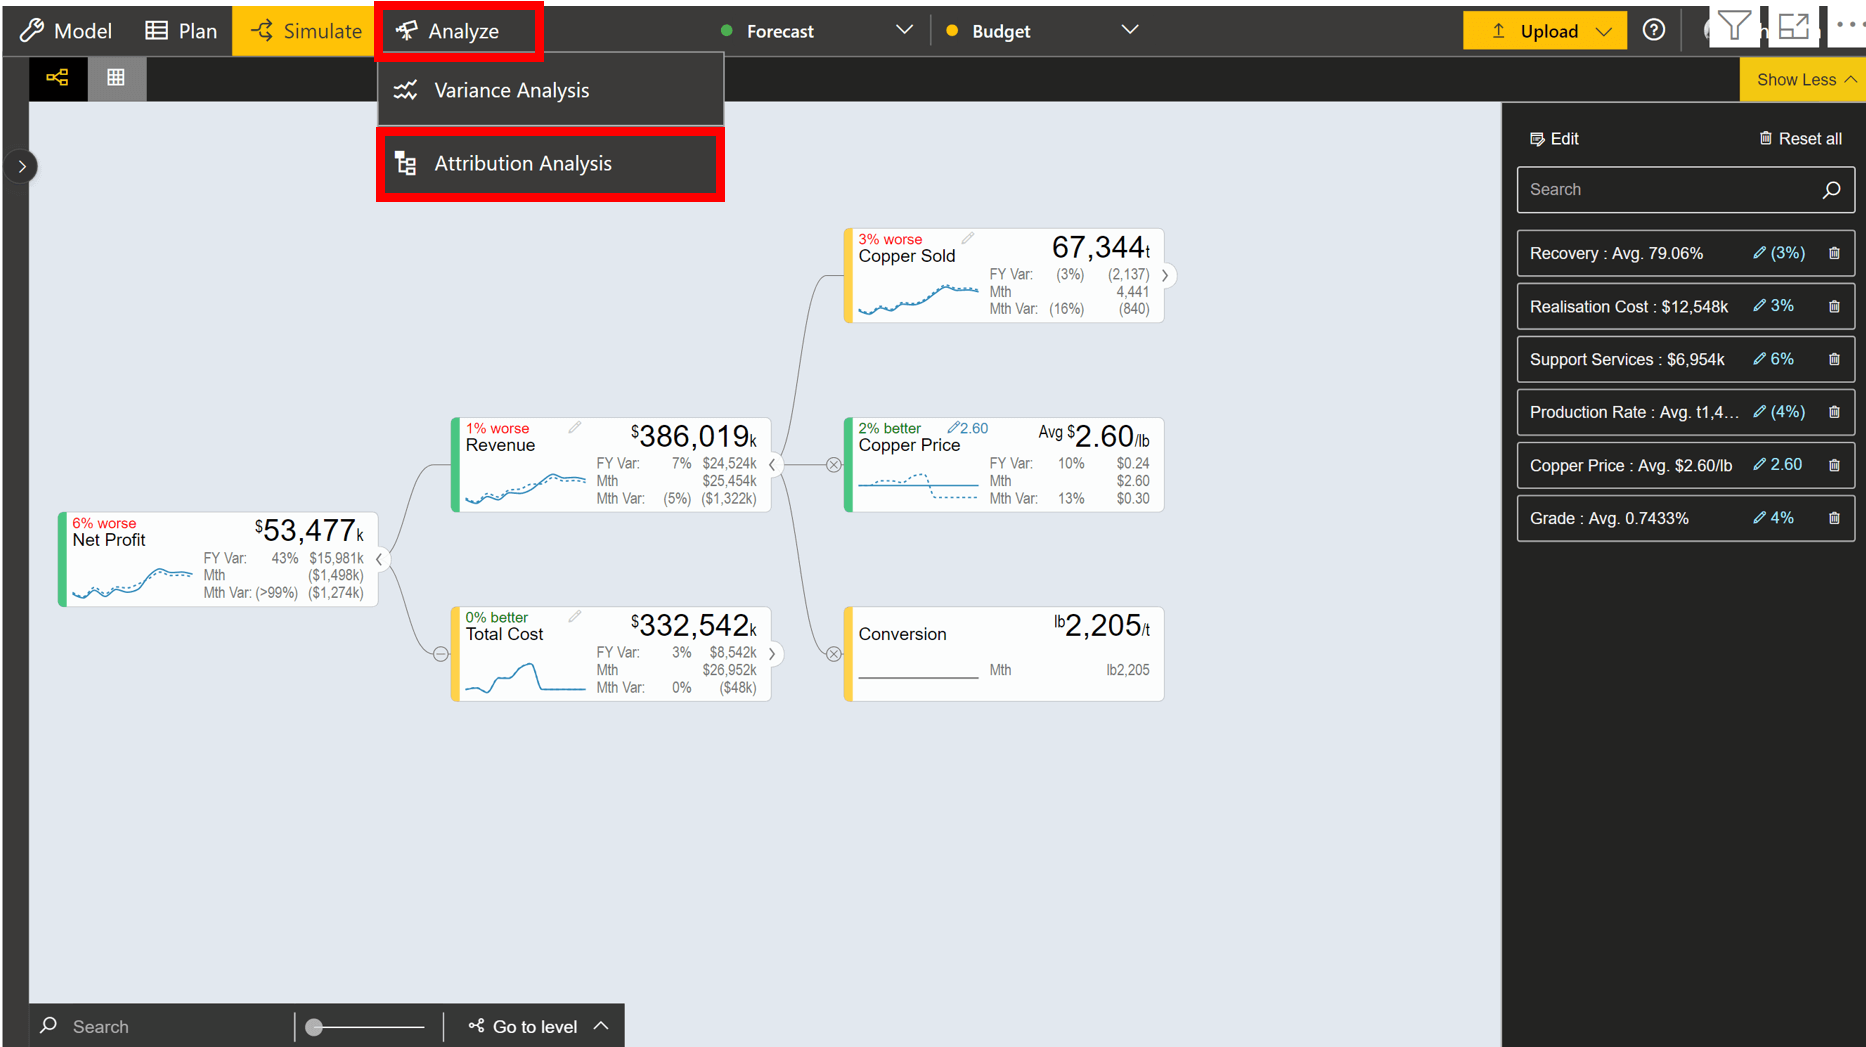
Consider the profitability of a mining operation that is shown below. Let us say you have performed some simulations which can be seen in the right panel. The effects of these simulated drivers on KPIs such as Net Profit can be analysed using Attribution Analysis.

1. In the ‘Analyze’ tab, click on ‘Attribution Analysis’.
2. The default screen is shown below. There are three parts in this screen – toolbar, waterfall chart and table.
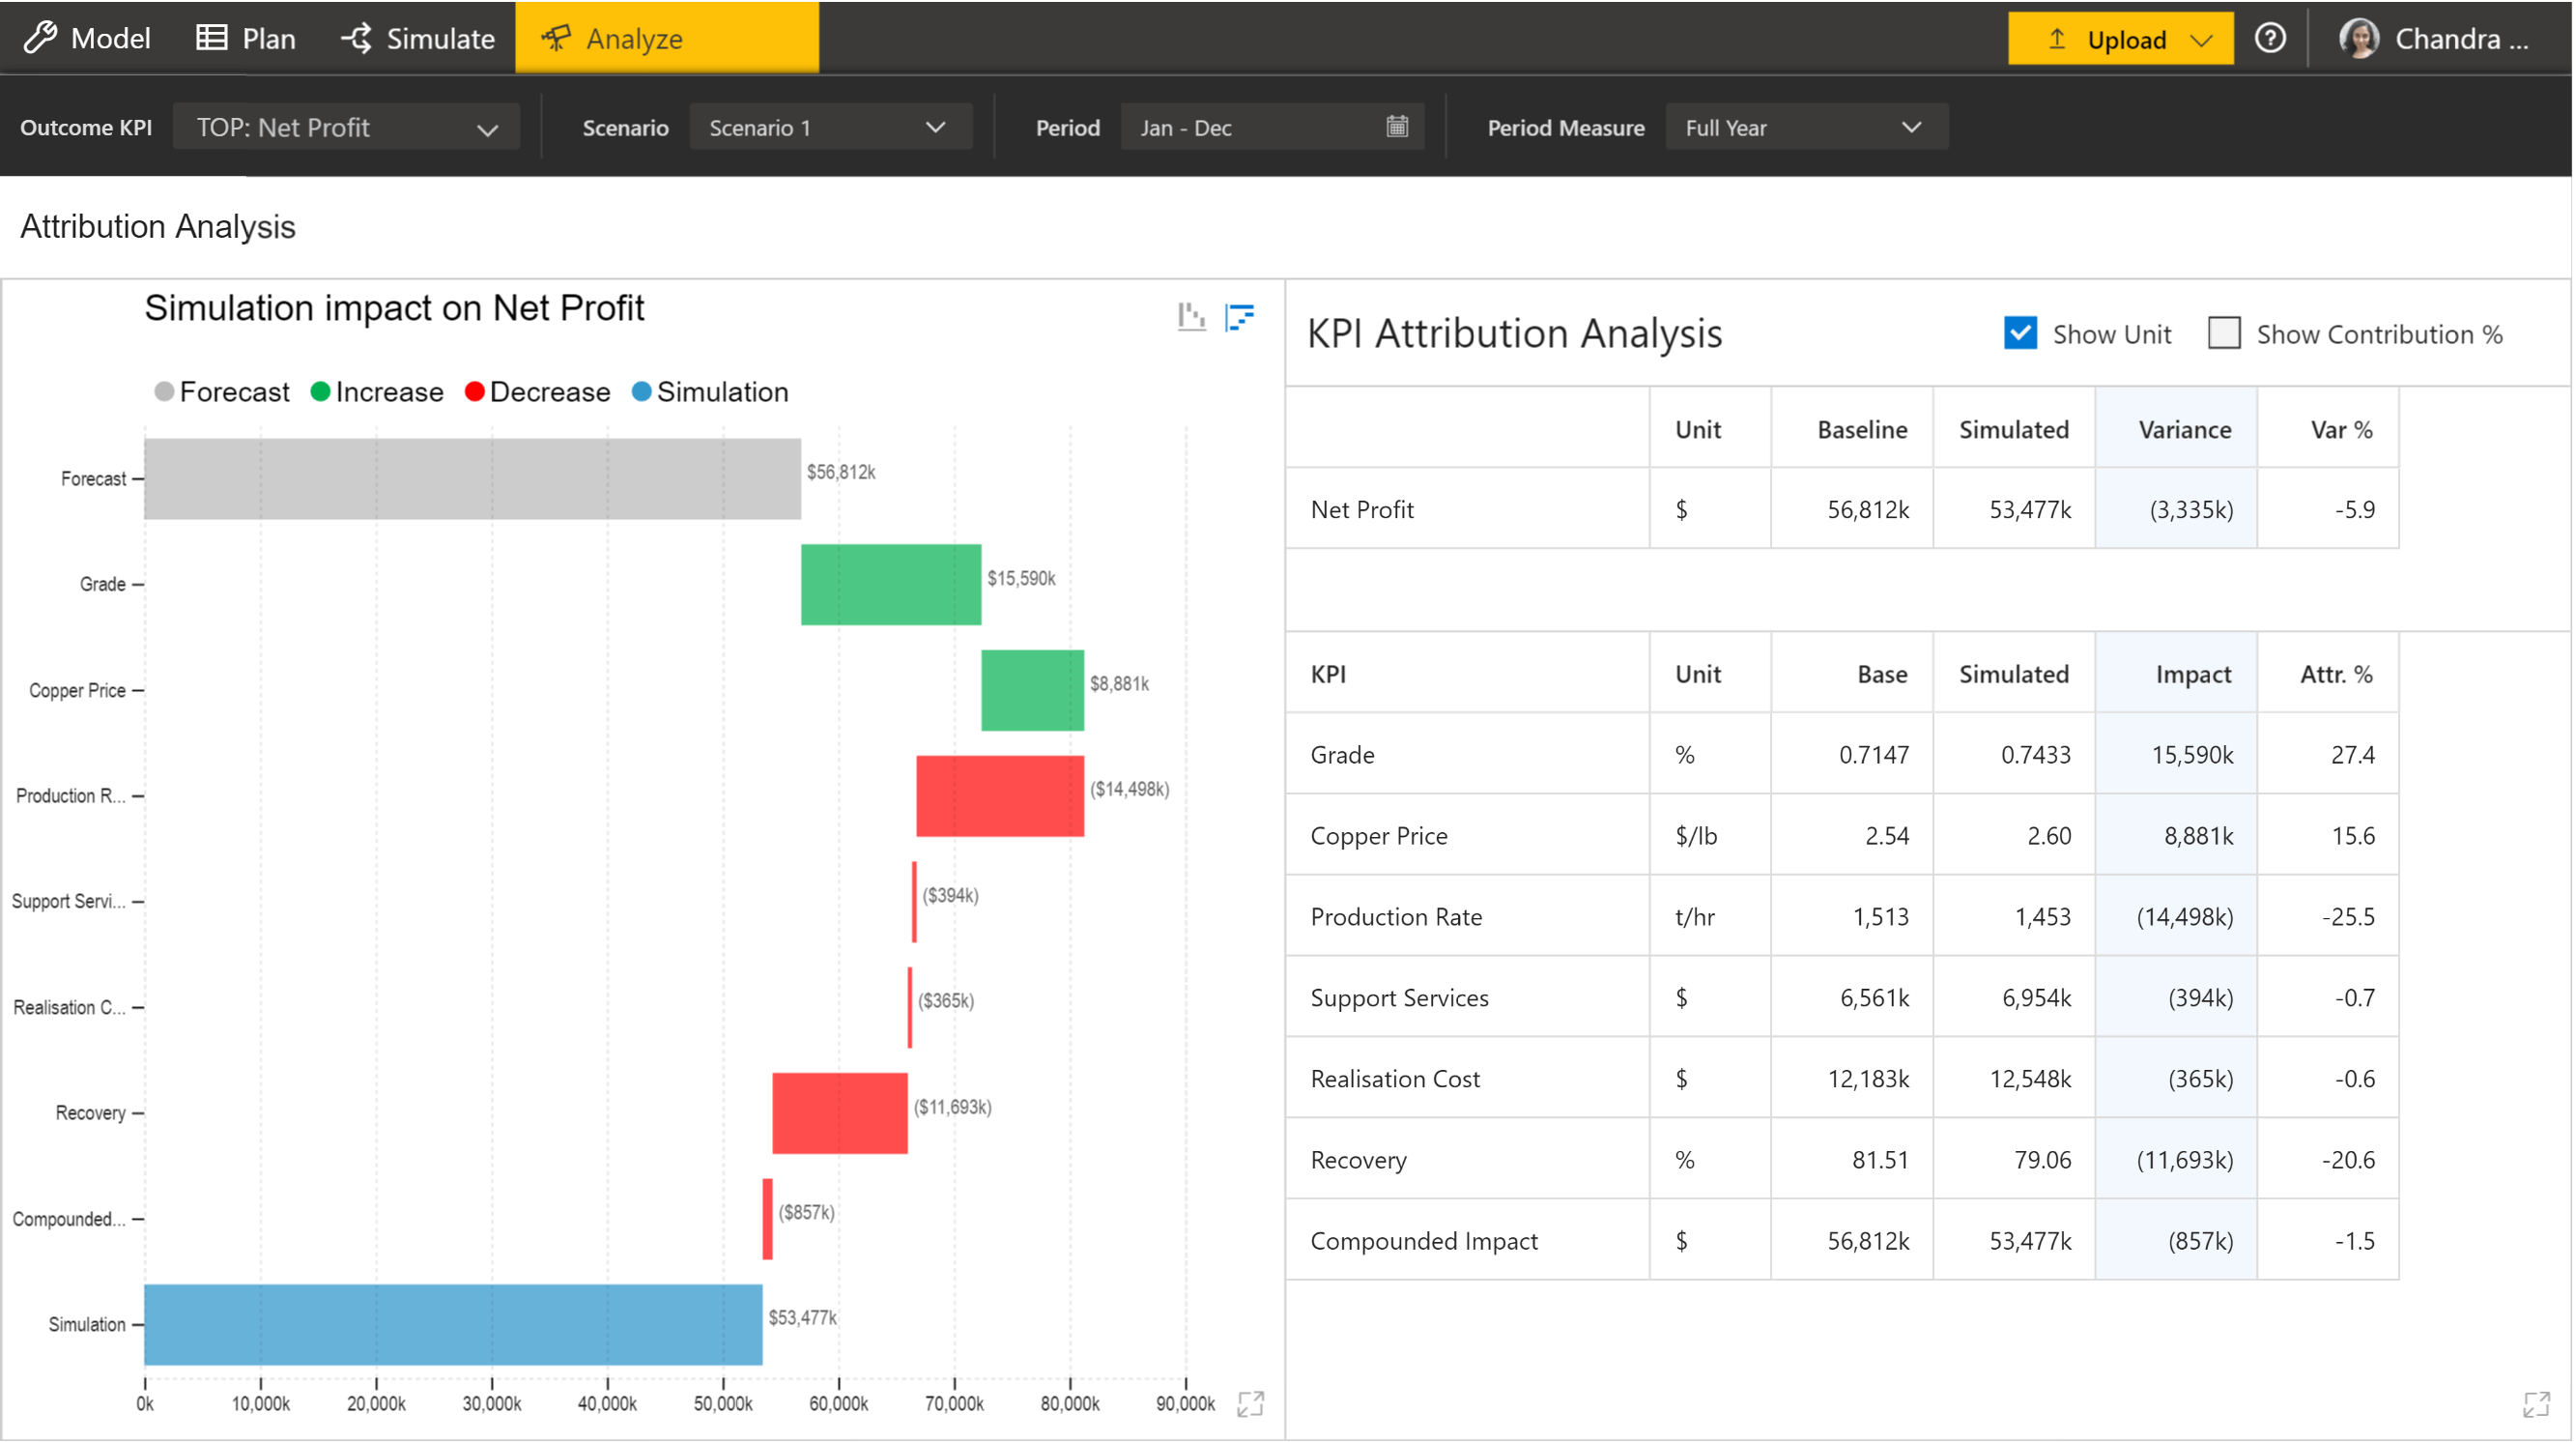
3. Let us first look at the waterfall chart. You can enter full-screen mode by clicking on the zoom icon at the bottom right. You can see the following:
- Forecast value is shown in grey
- Simulated value is shown in blue
- Simulations with positive and negative impact are shown in green and red respectively to explain the variation
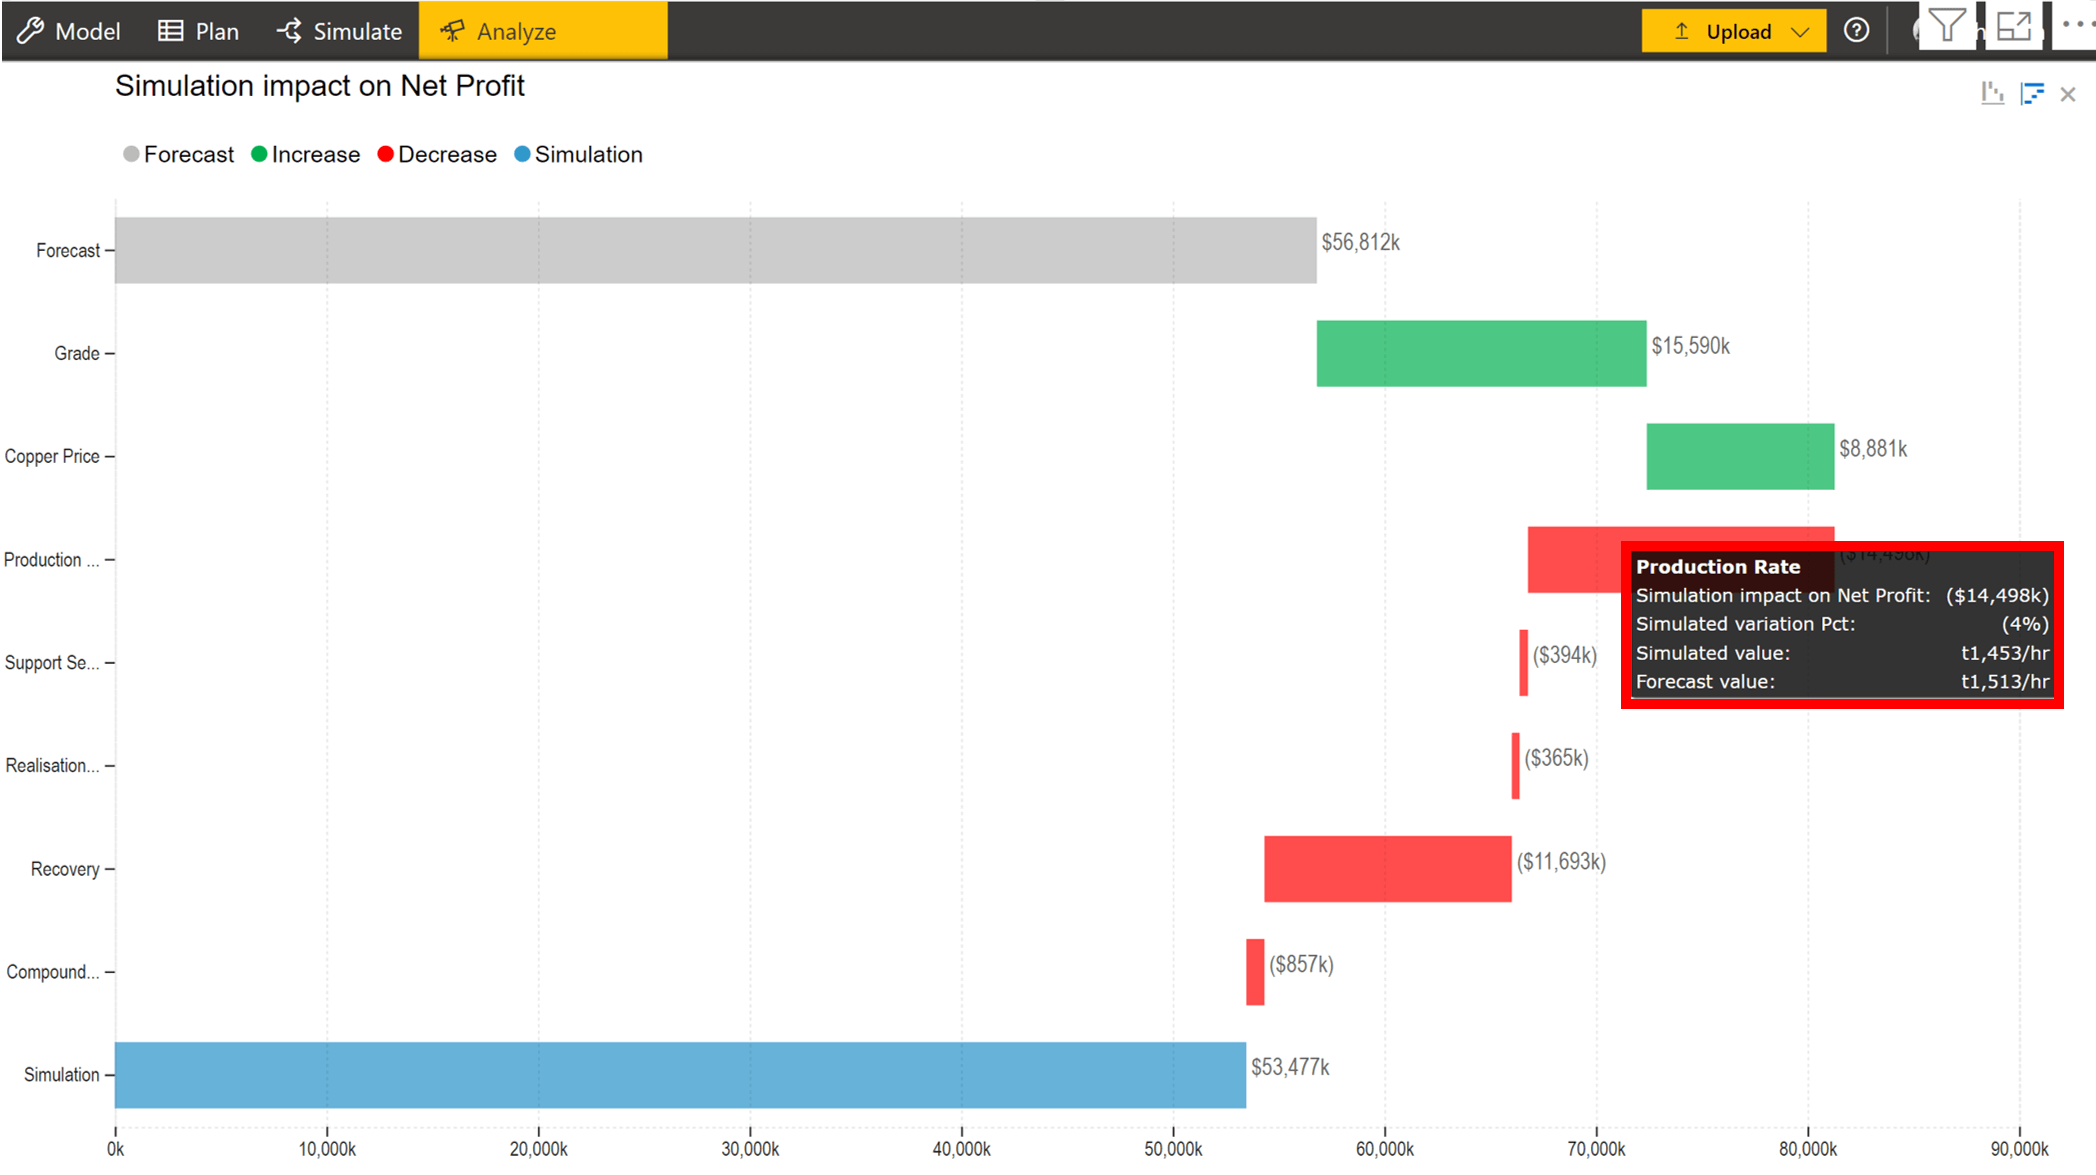
- On hovering over the bars, additional information such as the simulation impact and variation in percentage is displayed
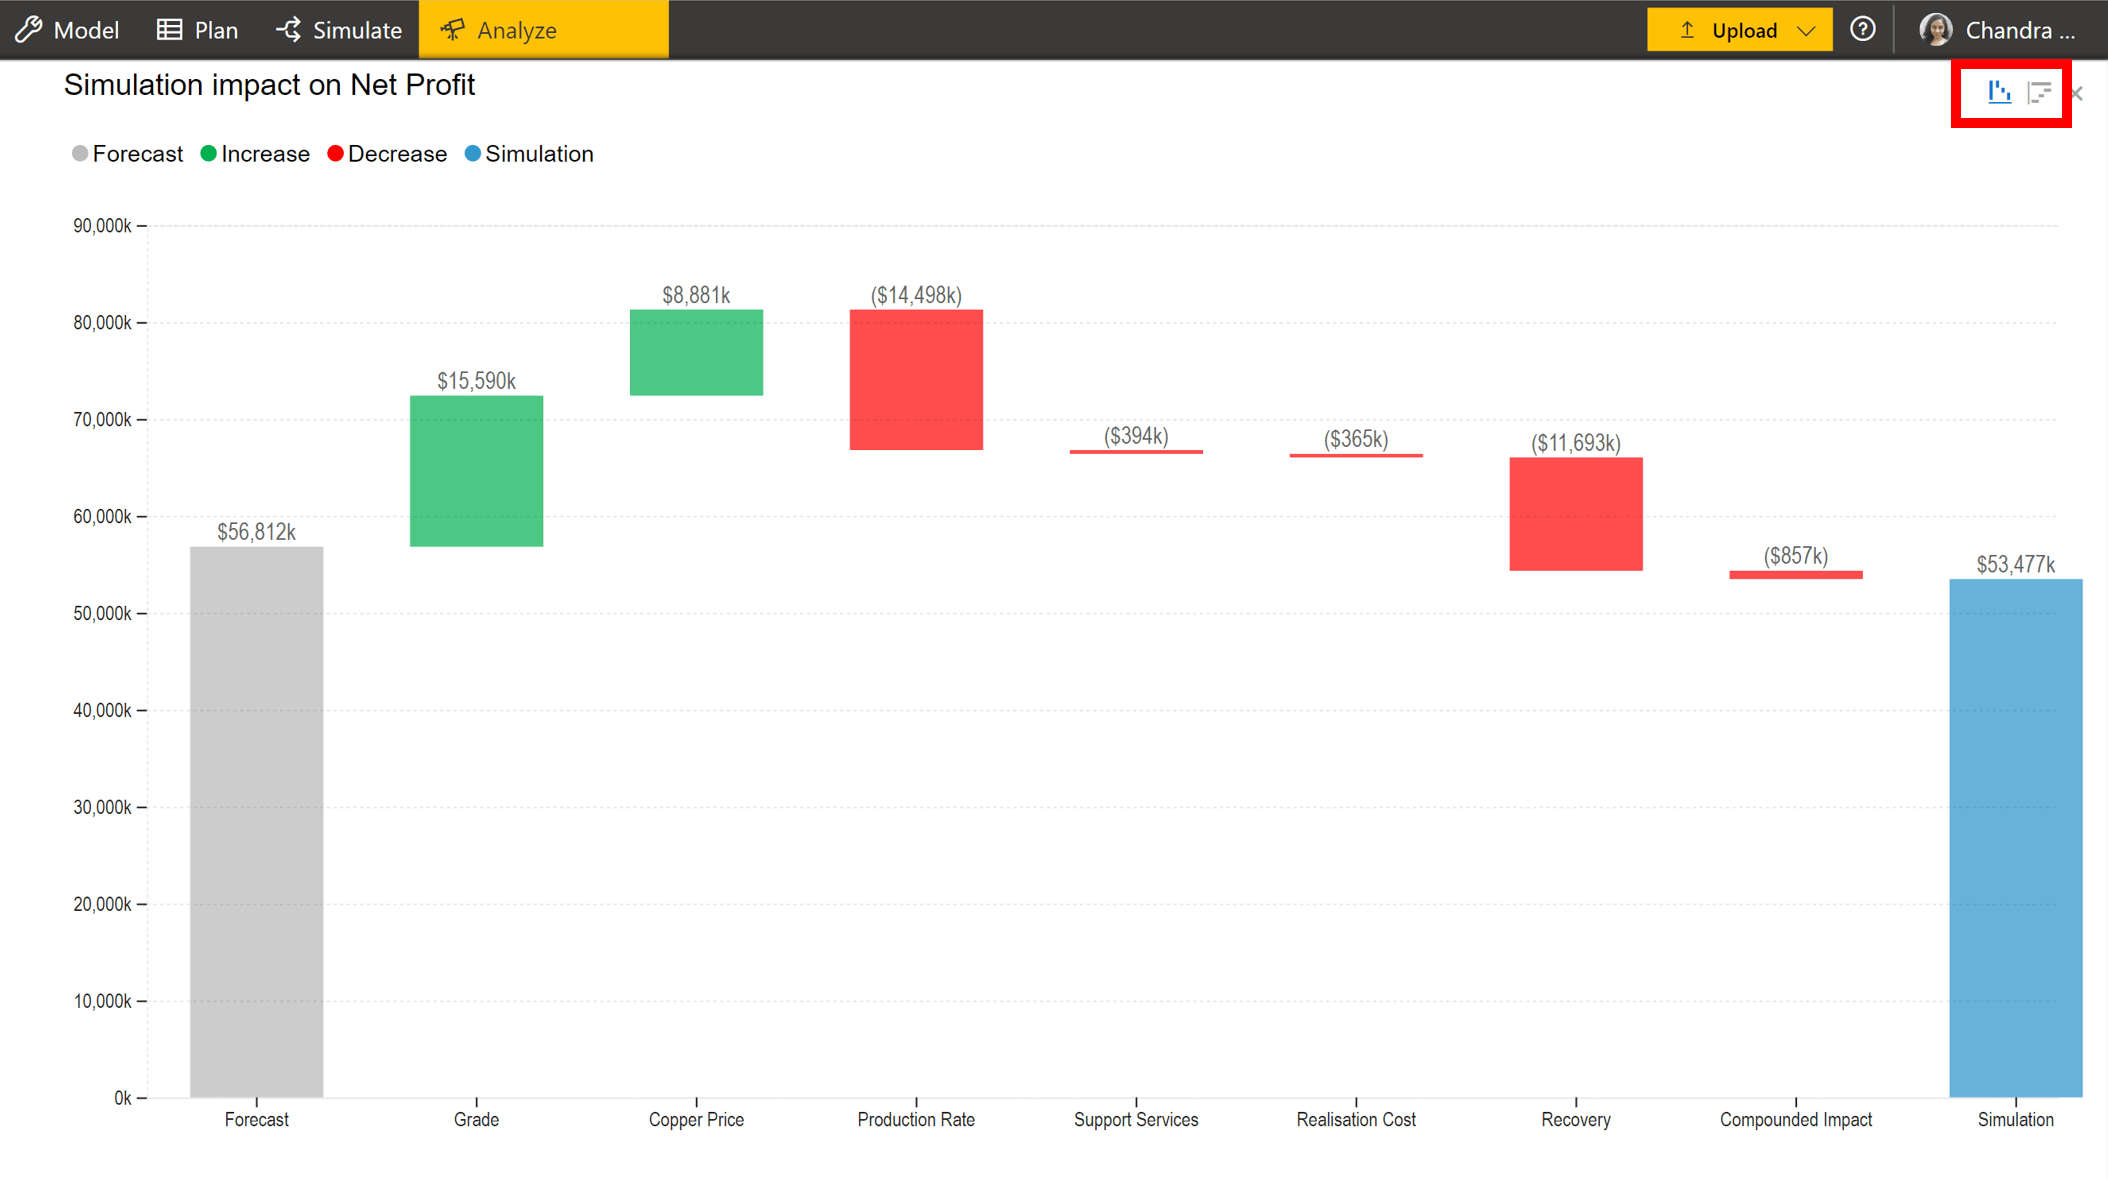
4. By clicking on the icons highlighted, you can toggle between horizontal and vertical waterfall charts.
5. Now, let us look at the table. By default, you can see
- For the outcome KPI – Baseline and Simulated values, Variance and Variance %
- For the drivers – Baseline and Simulated values, impact on outcome KPI and Attribution %
Attribution % is the contribution of the driver to the variance % of the outcome KPI. For example, a variance of (3,335k) in Net Profit corresponds to -5.9 in % terms. Consider the simulation impact of Grade, which is 15,590k hence its attribution % is 27.4.
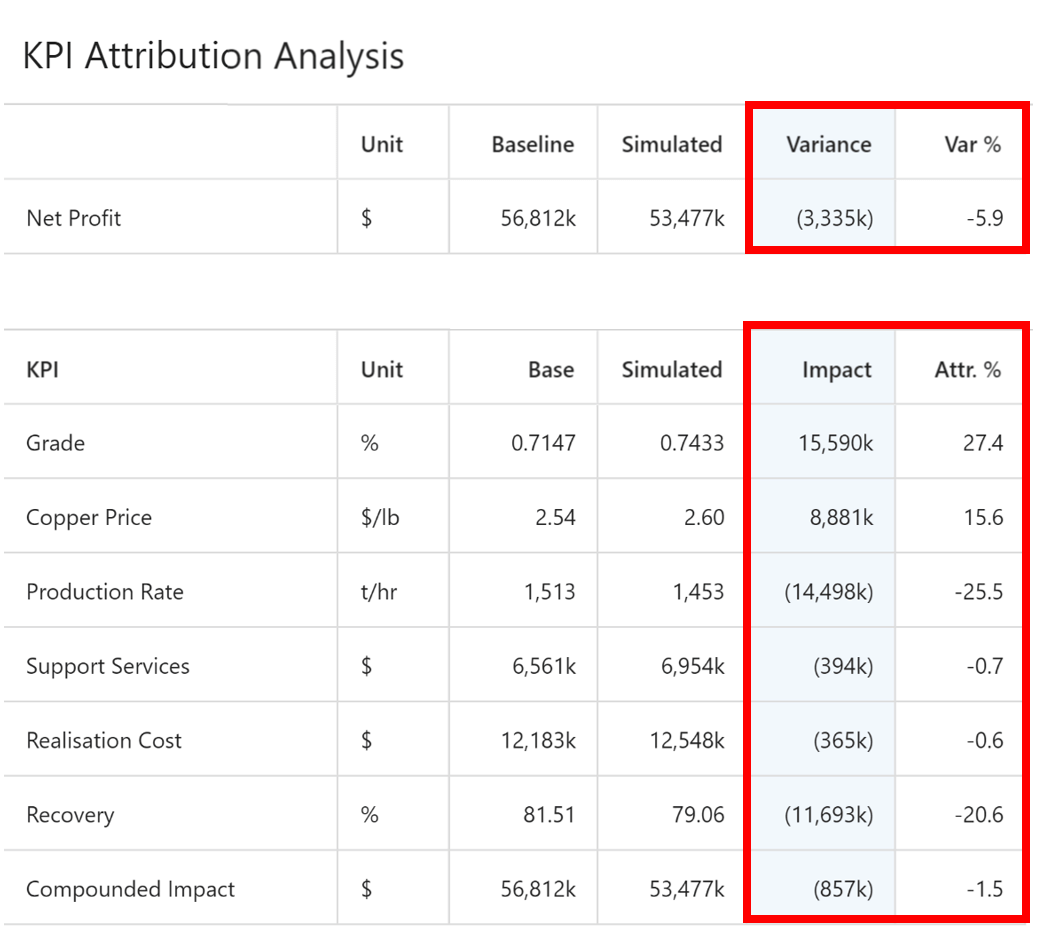
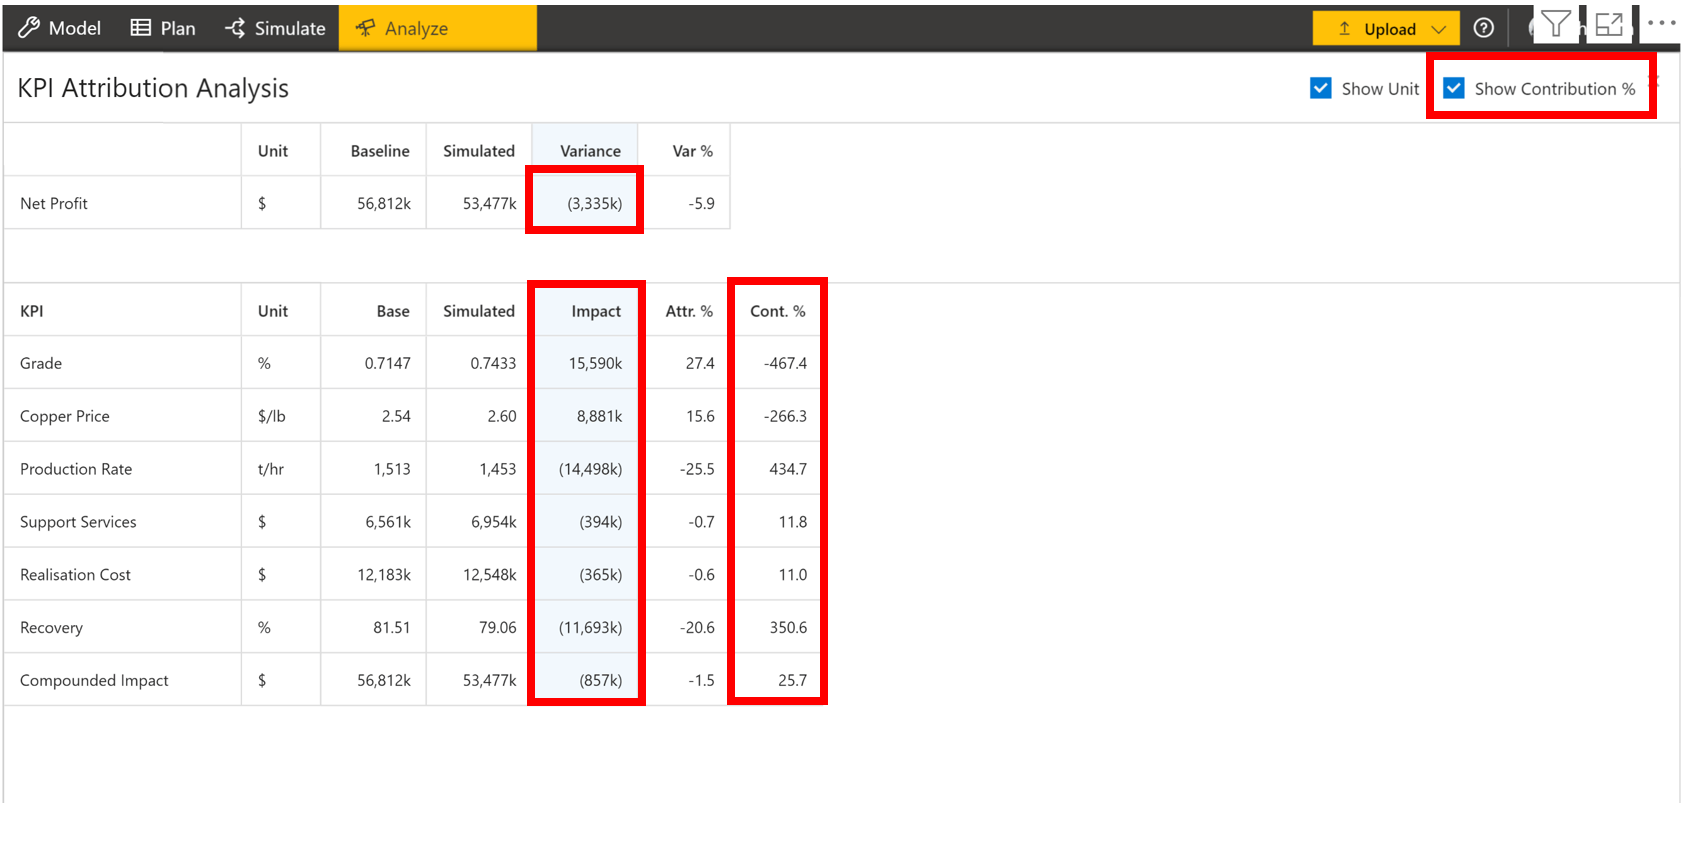
6. On the top right, you have the option to show/hide Contribution %. Contribution % is calculated as the contribution of the driver to the variance of the outcome KPI.
For example, Grade contributes 15,590k to Net Profit’s variance of (3,335k) which translates to a Contribution % of -467.4.
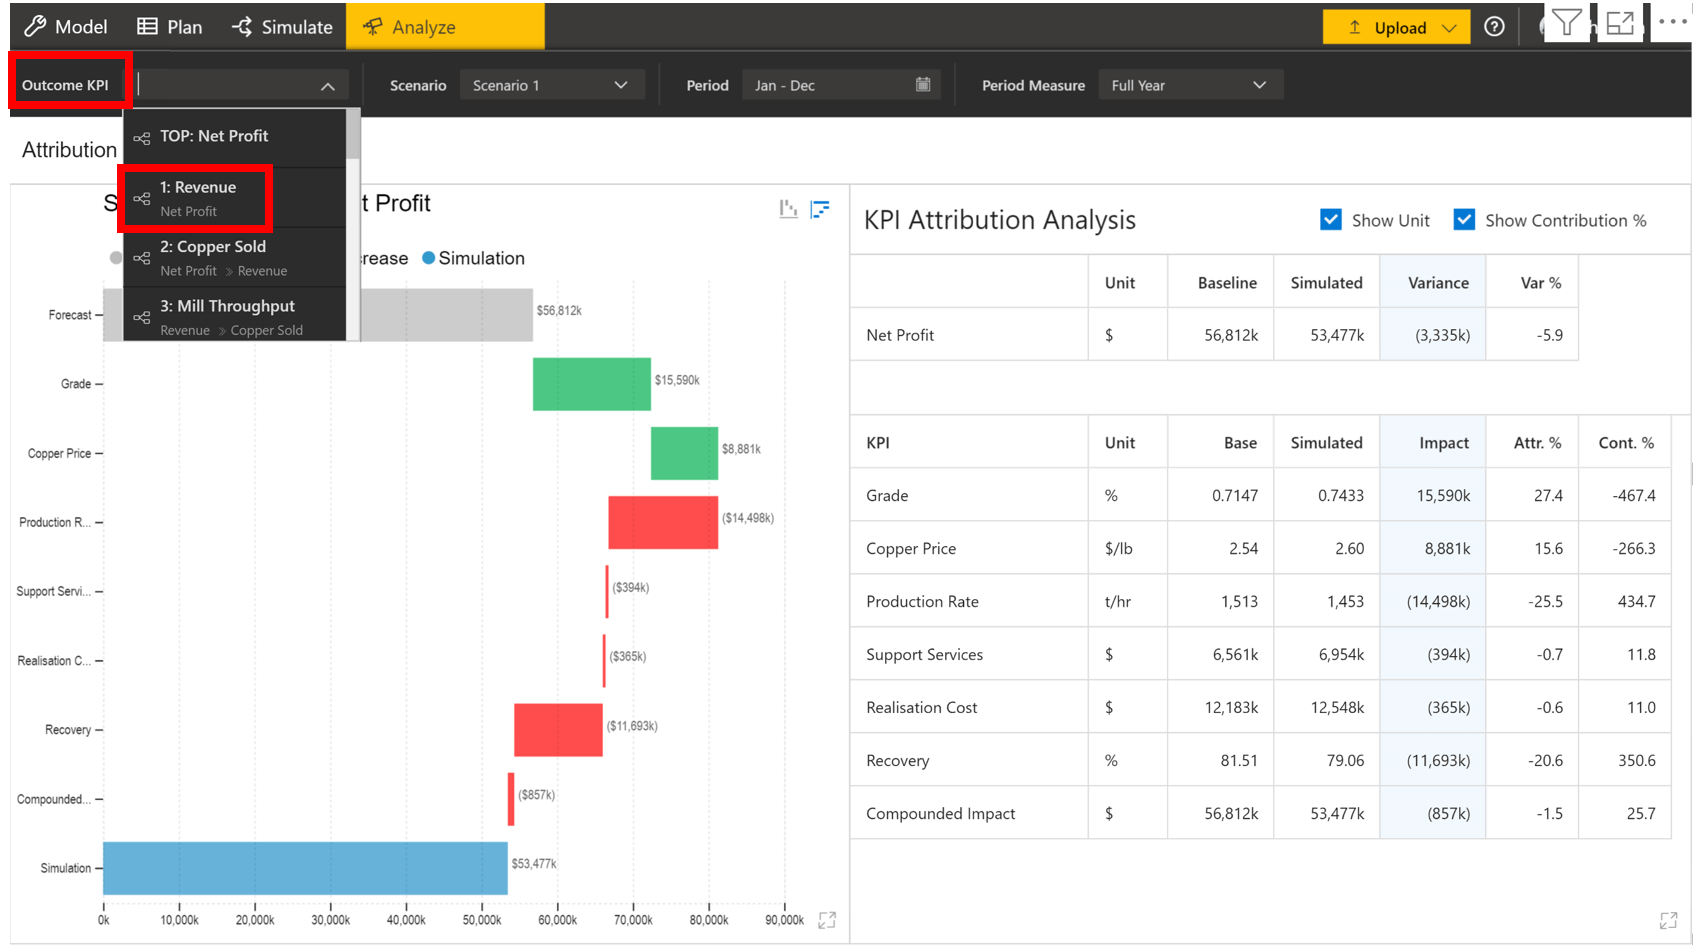
7. Similarly, you can perform attribution analysis for different KPIs by making the desired selection in the Outcome KPI field in the toolbar.
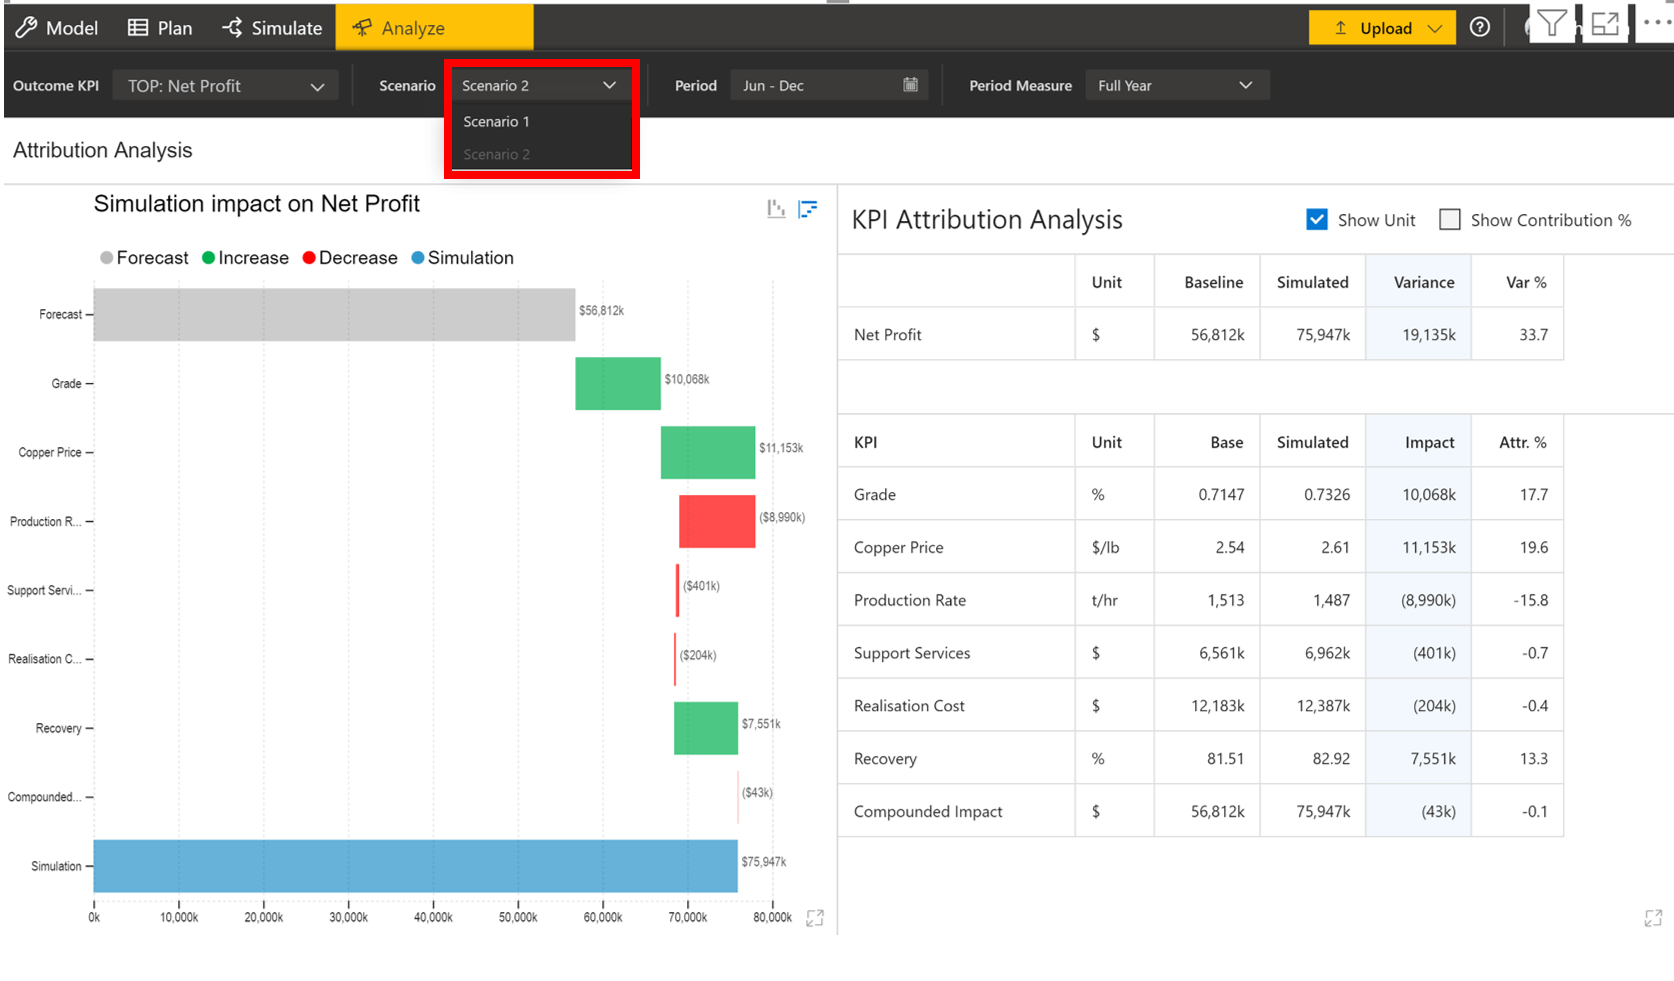
8. Scenarios created in the Simulate tab can be selected in the dropdown as shown.
To know more about the exciting features in ValQ 1.8, visit the summary blog here.
Download the latest version here and get started with ValQ today.


