ValQ is Visual BI’s solution for modern visual planning using Microsoft Power BI. It is a serverless, lightweight, multi-purpose application running on Power BI supporting use cases such as planning, forecasting, budgeting, time series forecasting, and value driver planning. ValQ is designed to enable executives, decision-makers and business analysts to seamlessly connect to data to make effective decisions. ValQ is fully customizable, mobile-compatible and has a highly engaging and intuitive interface. It is now available for SAP and Microsoft Power BI.
***
In the previous blog we took a look at one of the features of ValQ’s May 2019 release, the Table View. Here, let’s explore another exciting feature in this release – Dynamic Scaling Options.
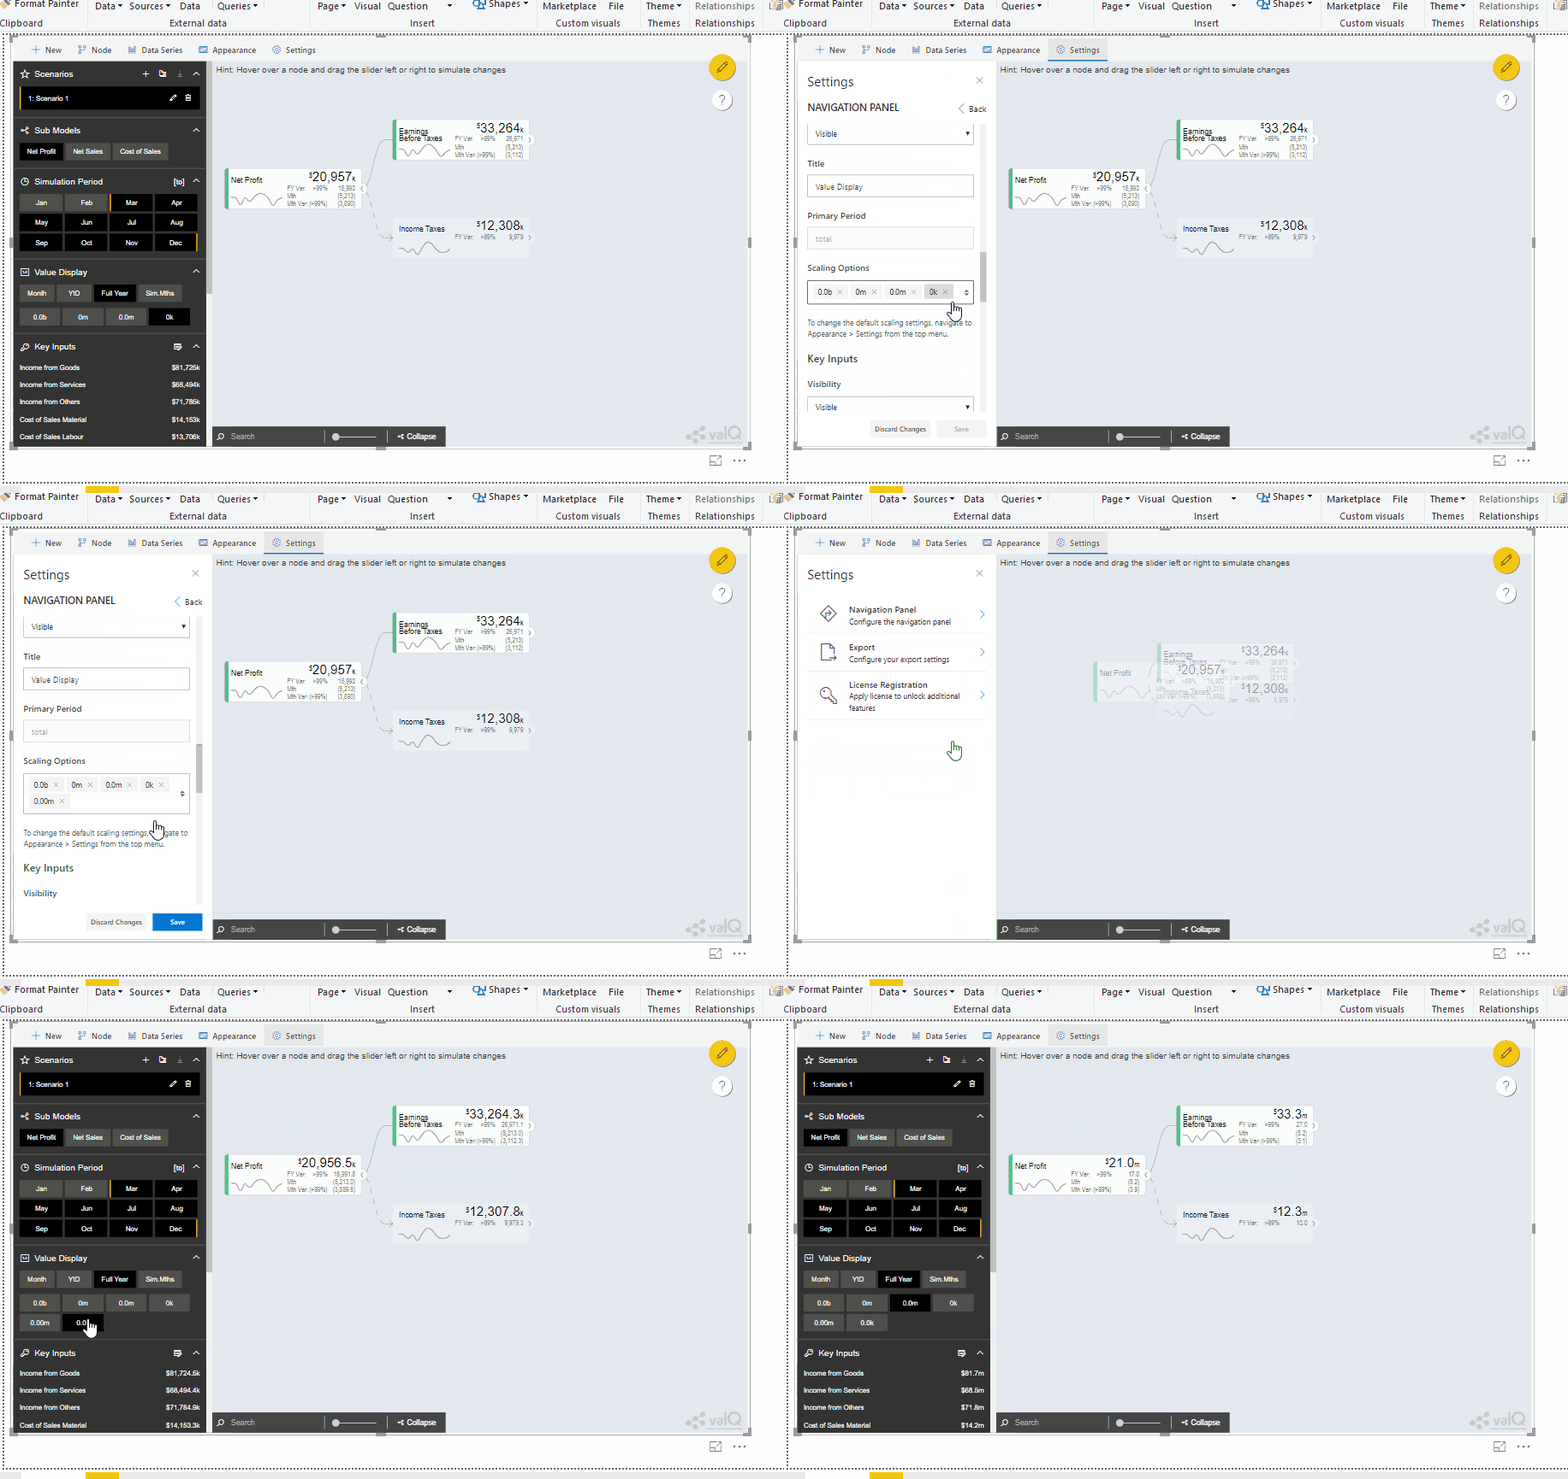
In ValQ, values for the Key Performance Indicators (KPIs) and drivers may range from a fraction of a number all the way to trillions. To manage readability, users have the ability to dynamically scale these values to e.g. millions, using the Value Display option in the navigation panel.
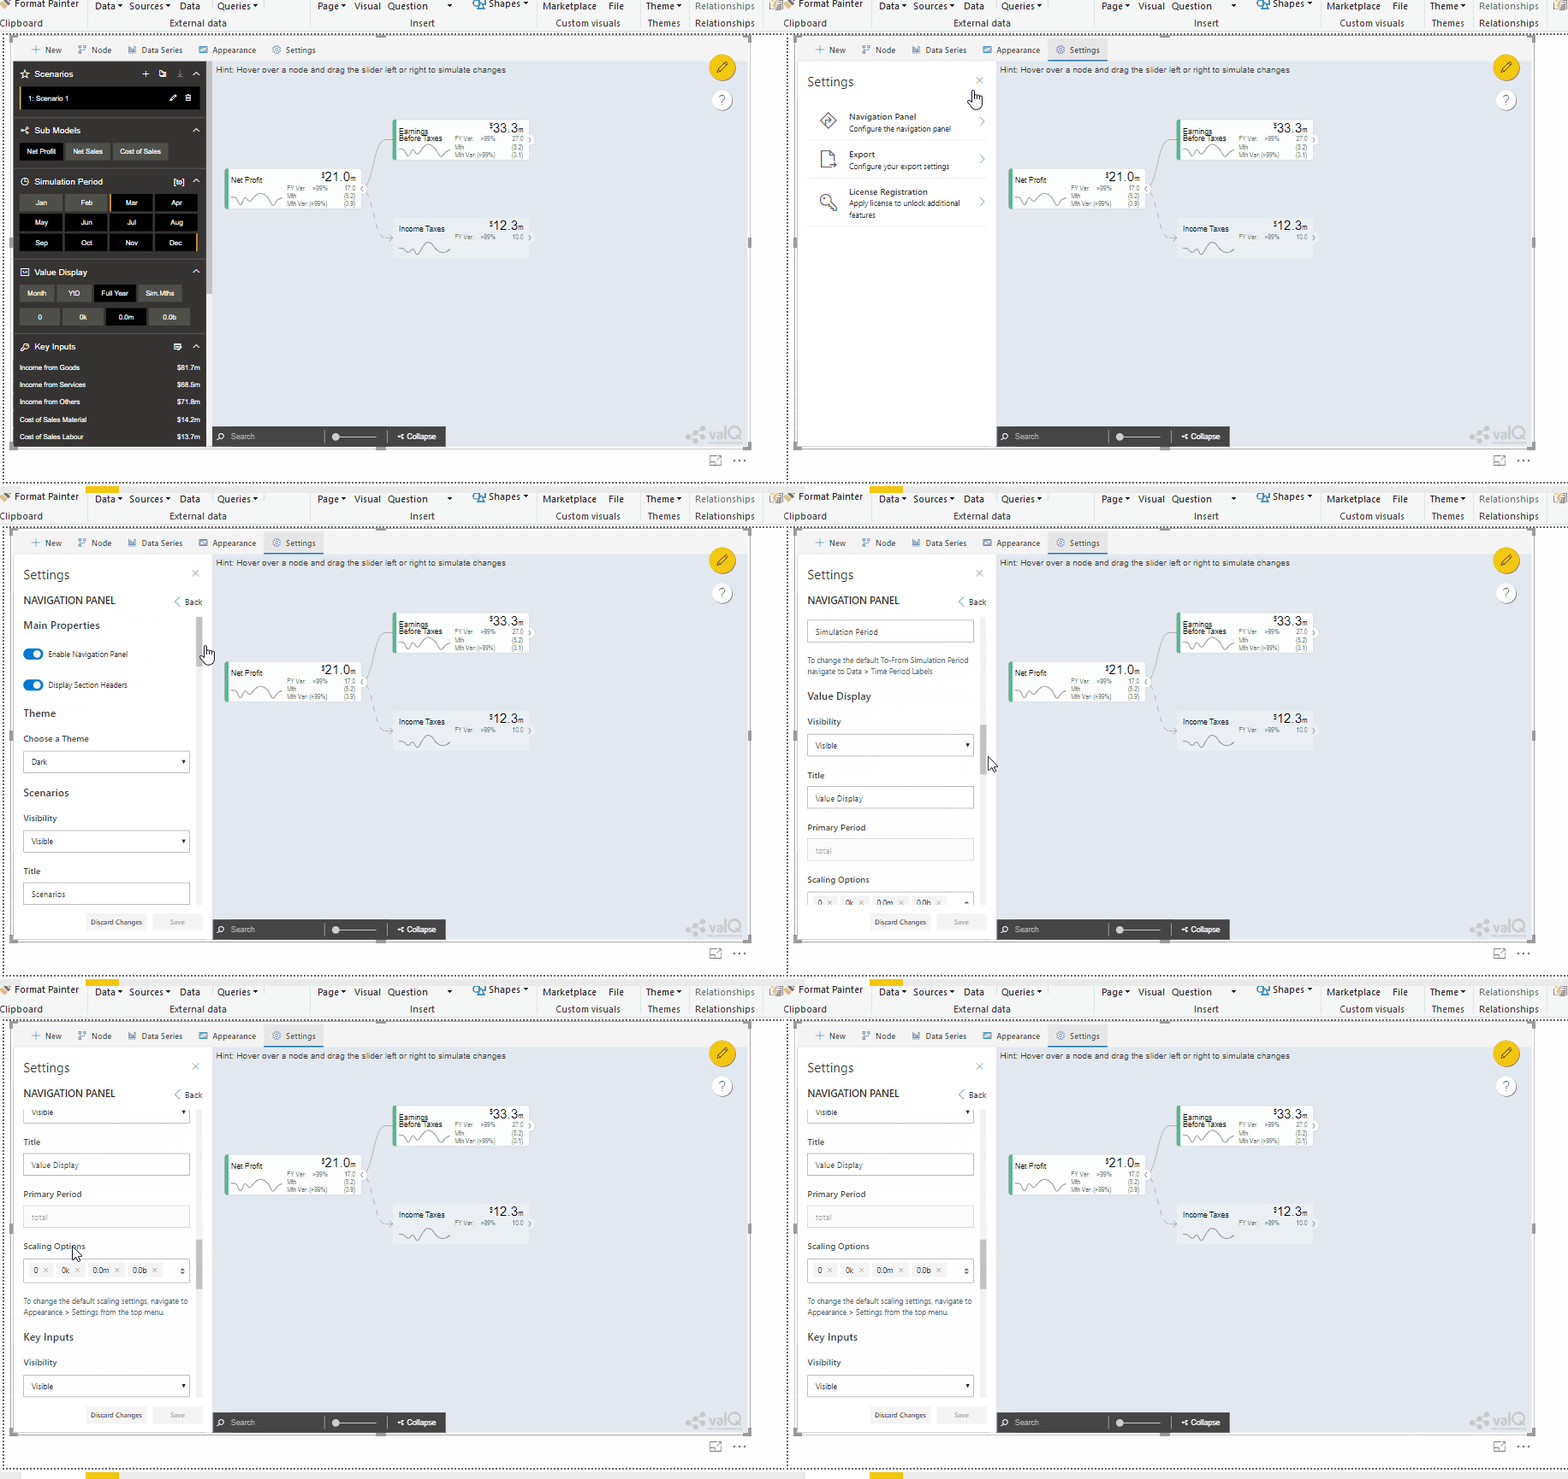
Follow the step-by-step instructions to customize the scaling options shown in the Value Display section
1, Open the ValQ model in the design/edit mode. Go to Settings -> Navigation panel -> Value display -> Scaling options.
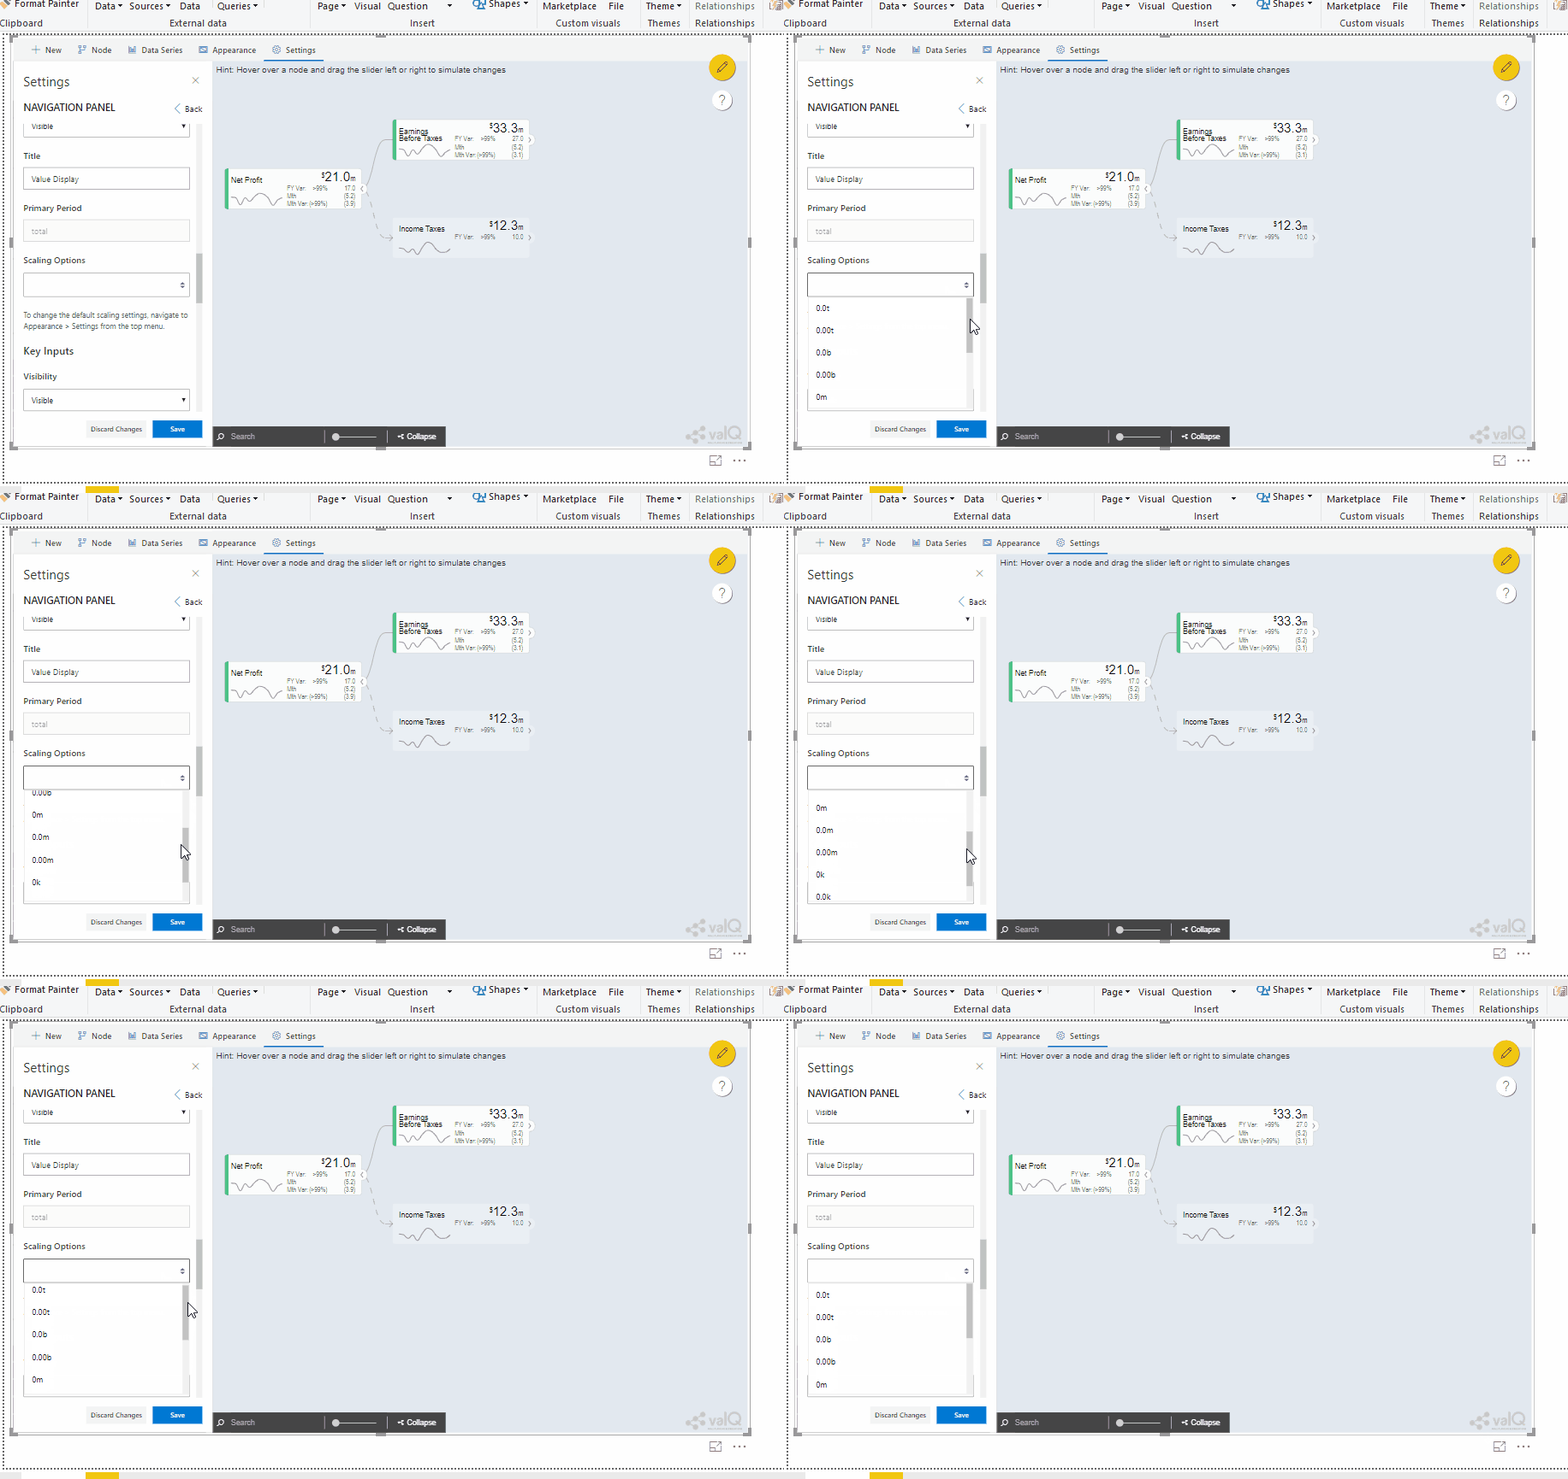
2. This presents you with a dropdown with the following options: 0.0t, 0.00t, 0.0b, 0.00b, 0m, 0.0m, 0.00m, 0.0k, and 0.
3. Pick and choose multiple options that you would like to show under Value Display. Save your changes and publish the report. You will be able to see the selected options now during runtime.
Note that the dynamic scaling can be disabled for specific nodes – e.g. nodes that show metrics such as cost/unit, profit margins which need to stay consistent irrespective of the scaling option chosen.
To learn more, tune into one of our ValQ Webinars or try our product for free here.


