
valQ allows you to use a variety of options for assigning values to nodes. You can use simple arithmetic calculations, complex formulas or reference other nodes.
To do this, first enter design mode. In the Node section, select the Edit and Configure option next to the particular node or double click on the node. Select the Configuration tab and then click on the Calculation method. You will see a list of options. We’ll look at some of them in detail; the rest will be covered in subsequent blogs.
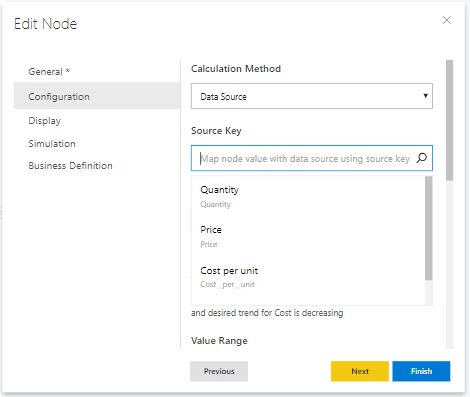
1) Data Source
For nodes which consume data from the databases, platforms/apps or other sources, use the data source option.
When you select the data source option, the source key field displays all the available options and you can assign the corresponding key to the node. Learn more about mapping nodes to data sources here.
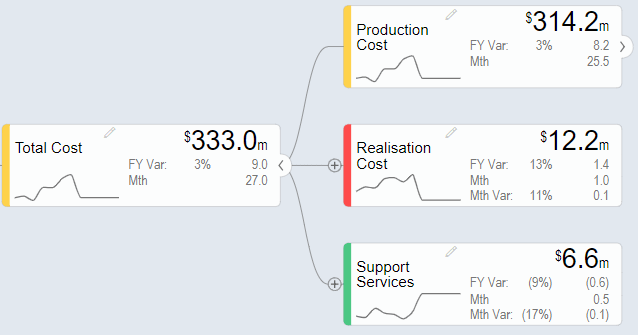
2) Sum Children
When the value for a node is the sum of the immediate child nodes, you can use the sum children option. In the example below, the total cost is the sum of production cost, realization cost, and support services and hence sum children option can be chosen.
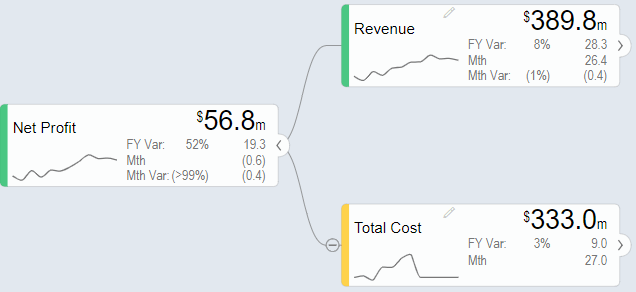
3) Subtract Children
Subtract children subtracts from the first immediate child all the other children (which are at the same level). Net profit is the difference between revenue and total cost and hence the node net profit is configured as subtract children.
4) Multiply Children
When the parent node is the product of the child nodes, you can use this option. For example, Revenue is the product of copper sold, copper price and conversion.

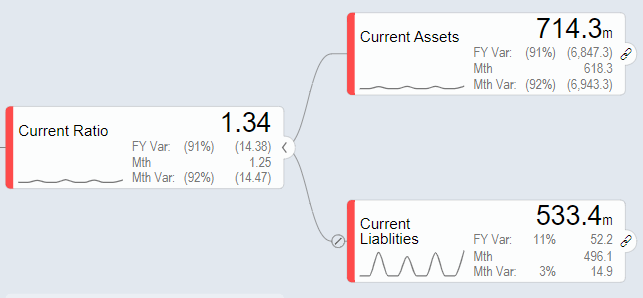
5) Divide Children
When the parent node is the ratio of the child nodes, use divide children option. The current ratio is current assets divided by current liabilities, hence it is assigned, Divide children.
6) Formula
You can also enter complex calculations using the formula option. You can refer to the nodes by typing @ and using node ID or node title and selecting the desired node from the drop-down. The formula preview shows the entered formula using the node titles thereby improving readability. We’ll look at this option in detail in subsequent blogs.
7) Linked to Node
Sometimes you may need one KPI to be utilized in different branches of the model. E.g. Your ‘quantity’ produced may impact sales as well as production, and so this may have to be placed in both the ‘revenue’ sub-tree as well as the ‘costs’ sub-tree, but these nodes need to mirror each other at all times. The linked node helps you achieve this.
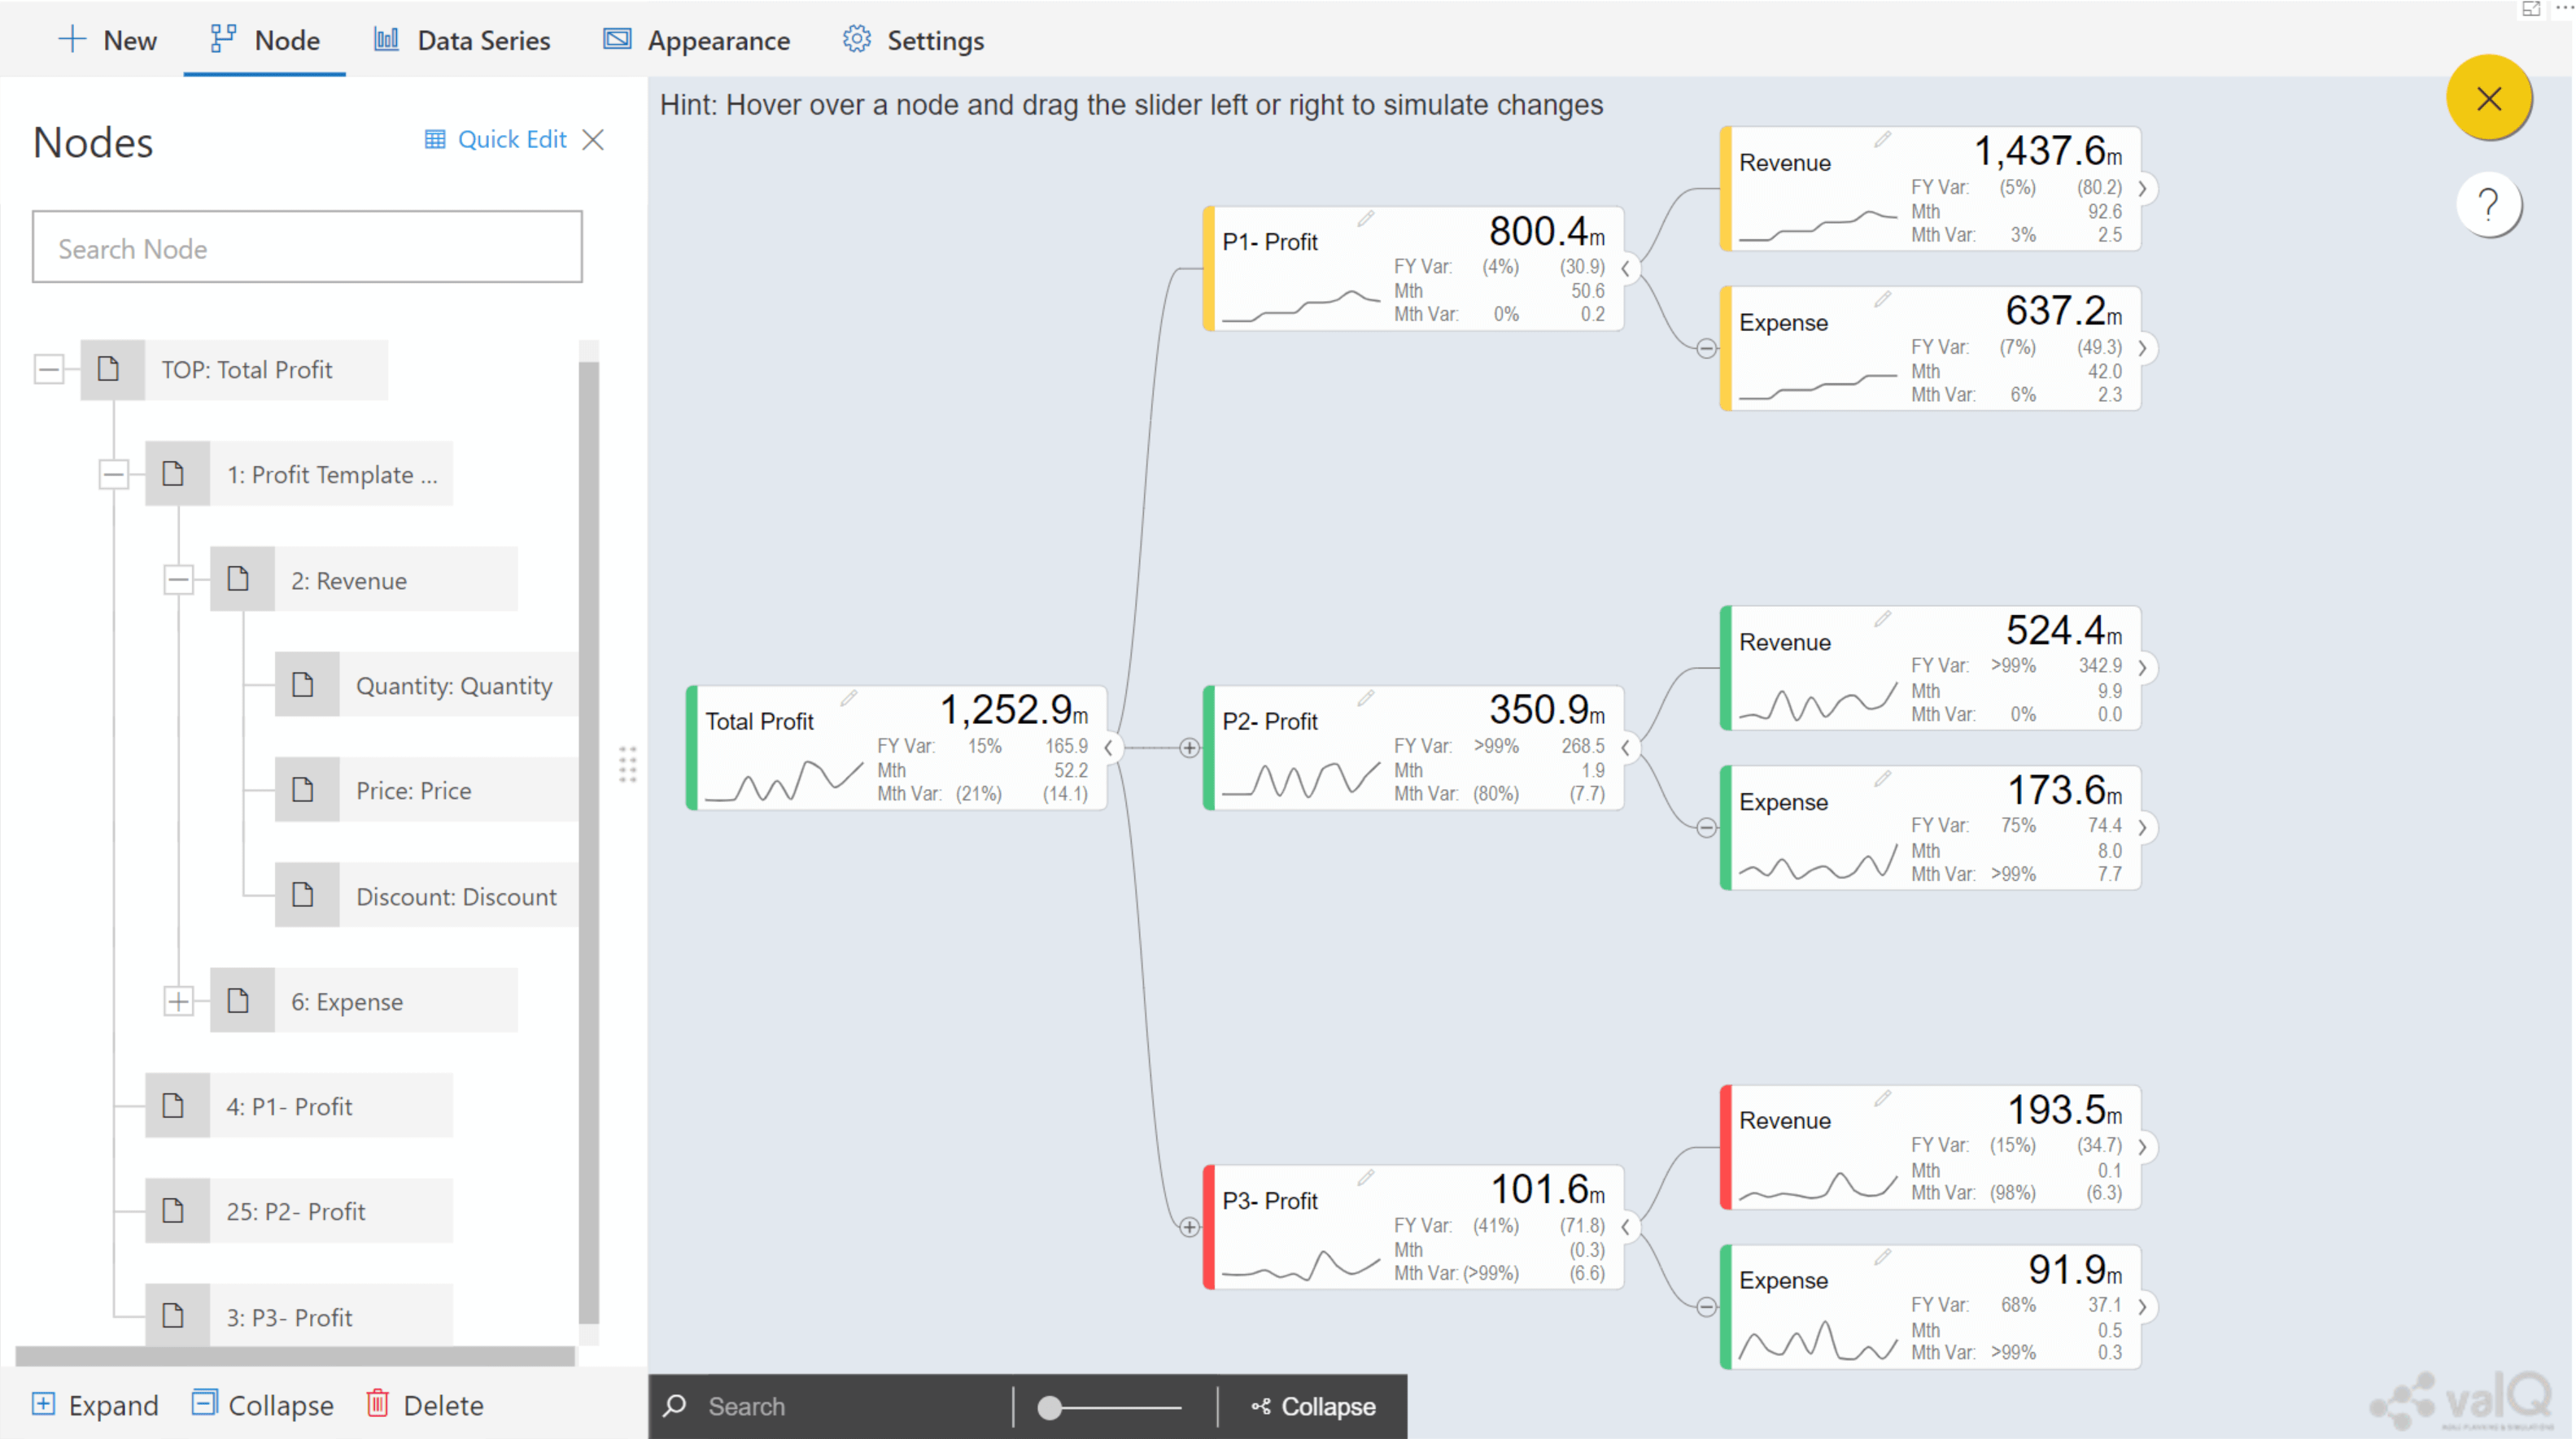
8) Template based on another node
You may have situations where a portion of the tree needs to repeat itself at different parts of the model. E.g. The P&L structure needs to be repeated for multiple geographies. With the template feature, you can create a template once and use it many times. In addition, any future changes need to be done only in the template – thereby saving time and ensuring ease of maintenance. Since this is an advanced topic, we’ll be covering this in one of the subsequent blogs.
9) Manual
In cases where you just want to enter values manually, you can choose the manual option. You can enter both the primary and comparison values for all periods. This is typically used when your data warehouse is not ready to provide values for specific nodes or KPIs – and you can use this as a shortcut for building out the entire model.

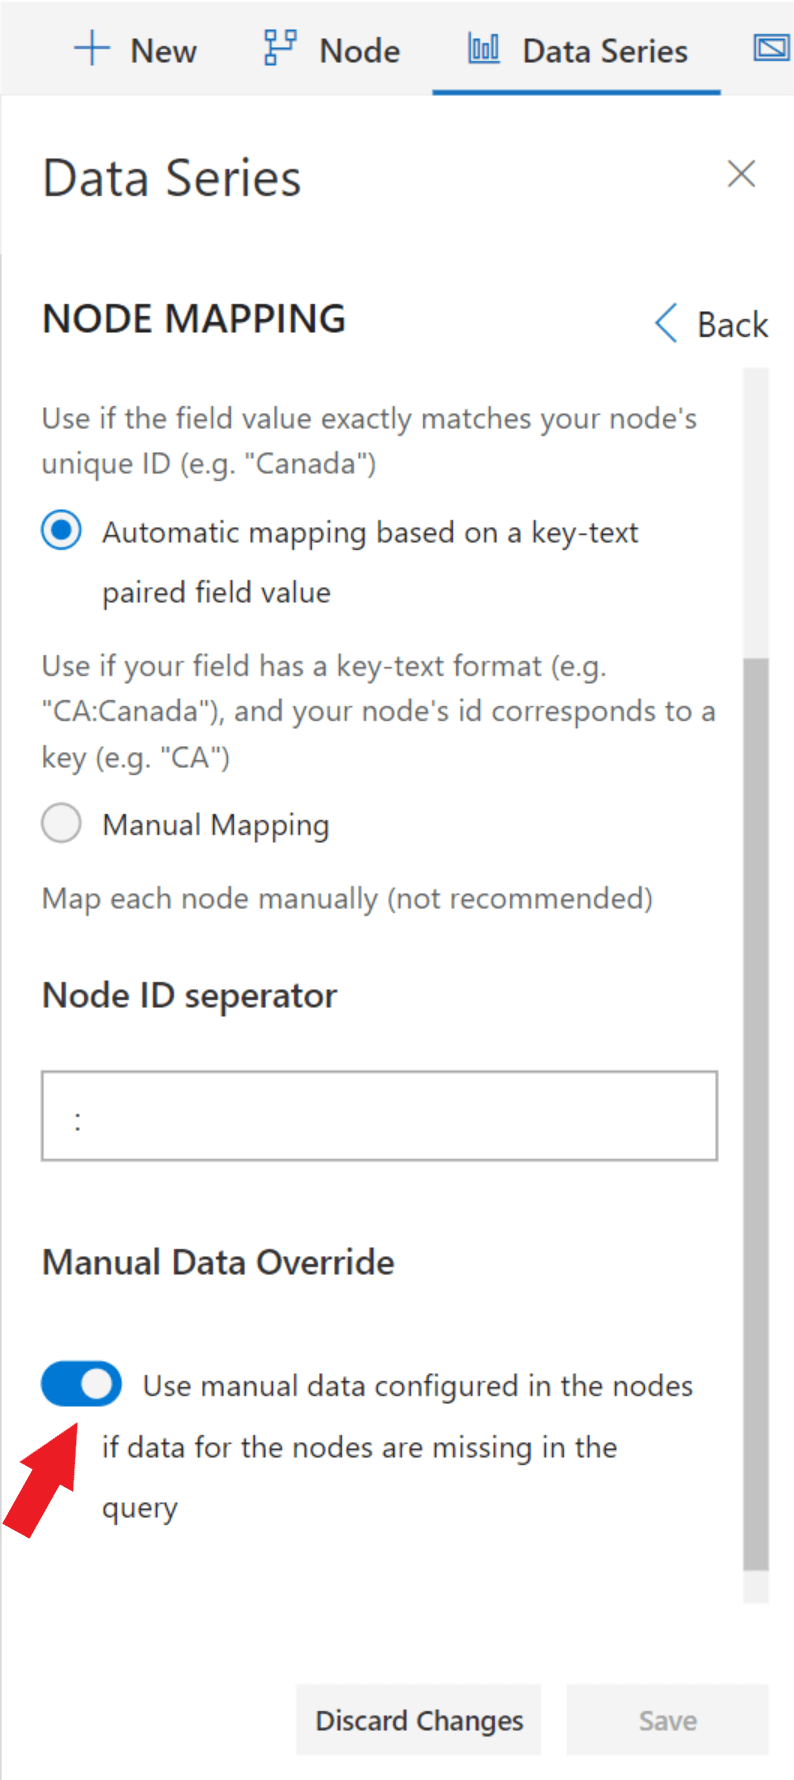
Entering values here has another benefit. If you map your node to consume data from the data source – but in the future, your query fails to retrieve data for these KPIs, you can have ValQ substitute these manual entries at run-time instead. To enable this, you will have to turn on another setting: Data Series -> Node Mapping -> Manual Data Override.
To learn more, tune into one of our ValQ Webinars or try our product for free here.


