
What’s new in ValQ 1.9?
With continuous improvements in mind, the latest release of ValQ 1.9 version comes with multiple updates and much-awaited performance enhancement attributes, for a better user experience. In this blog, let’s have a look at these upgrades and other brand-new features of Valq 1.9 in detail:
Features previously in Collaborate, now available in Certified Version:
- Attribution Analysis is now a part of the Certified Version (for Enterprise Plan). For more insights on Attribution Analysis click here.
- Zero Based Budgeting in the Plan Tab has been included in this version. To know more about Zero Based Budgeting on ValQ click here.
New Feature Updates:
1.Table View
It is now possible to view your Data Model in a Table View, in addition to the already existing Tree View. Consider this example of a P&L Model. Click on the ‘Table View’ icon for your model to display in a table format.
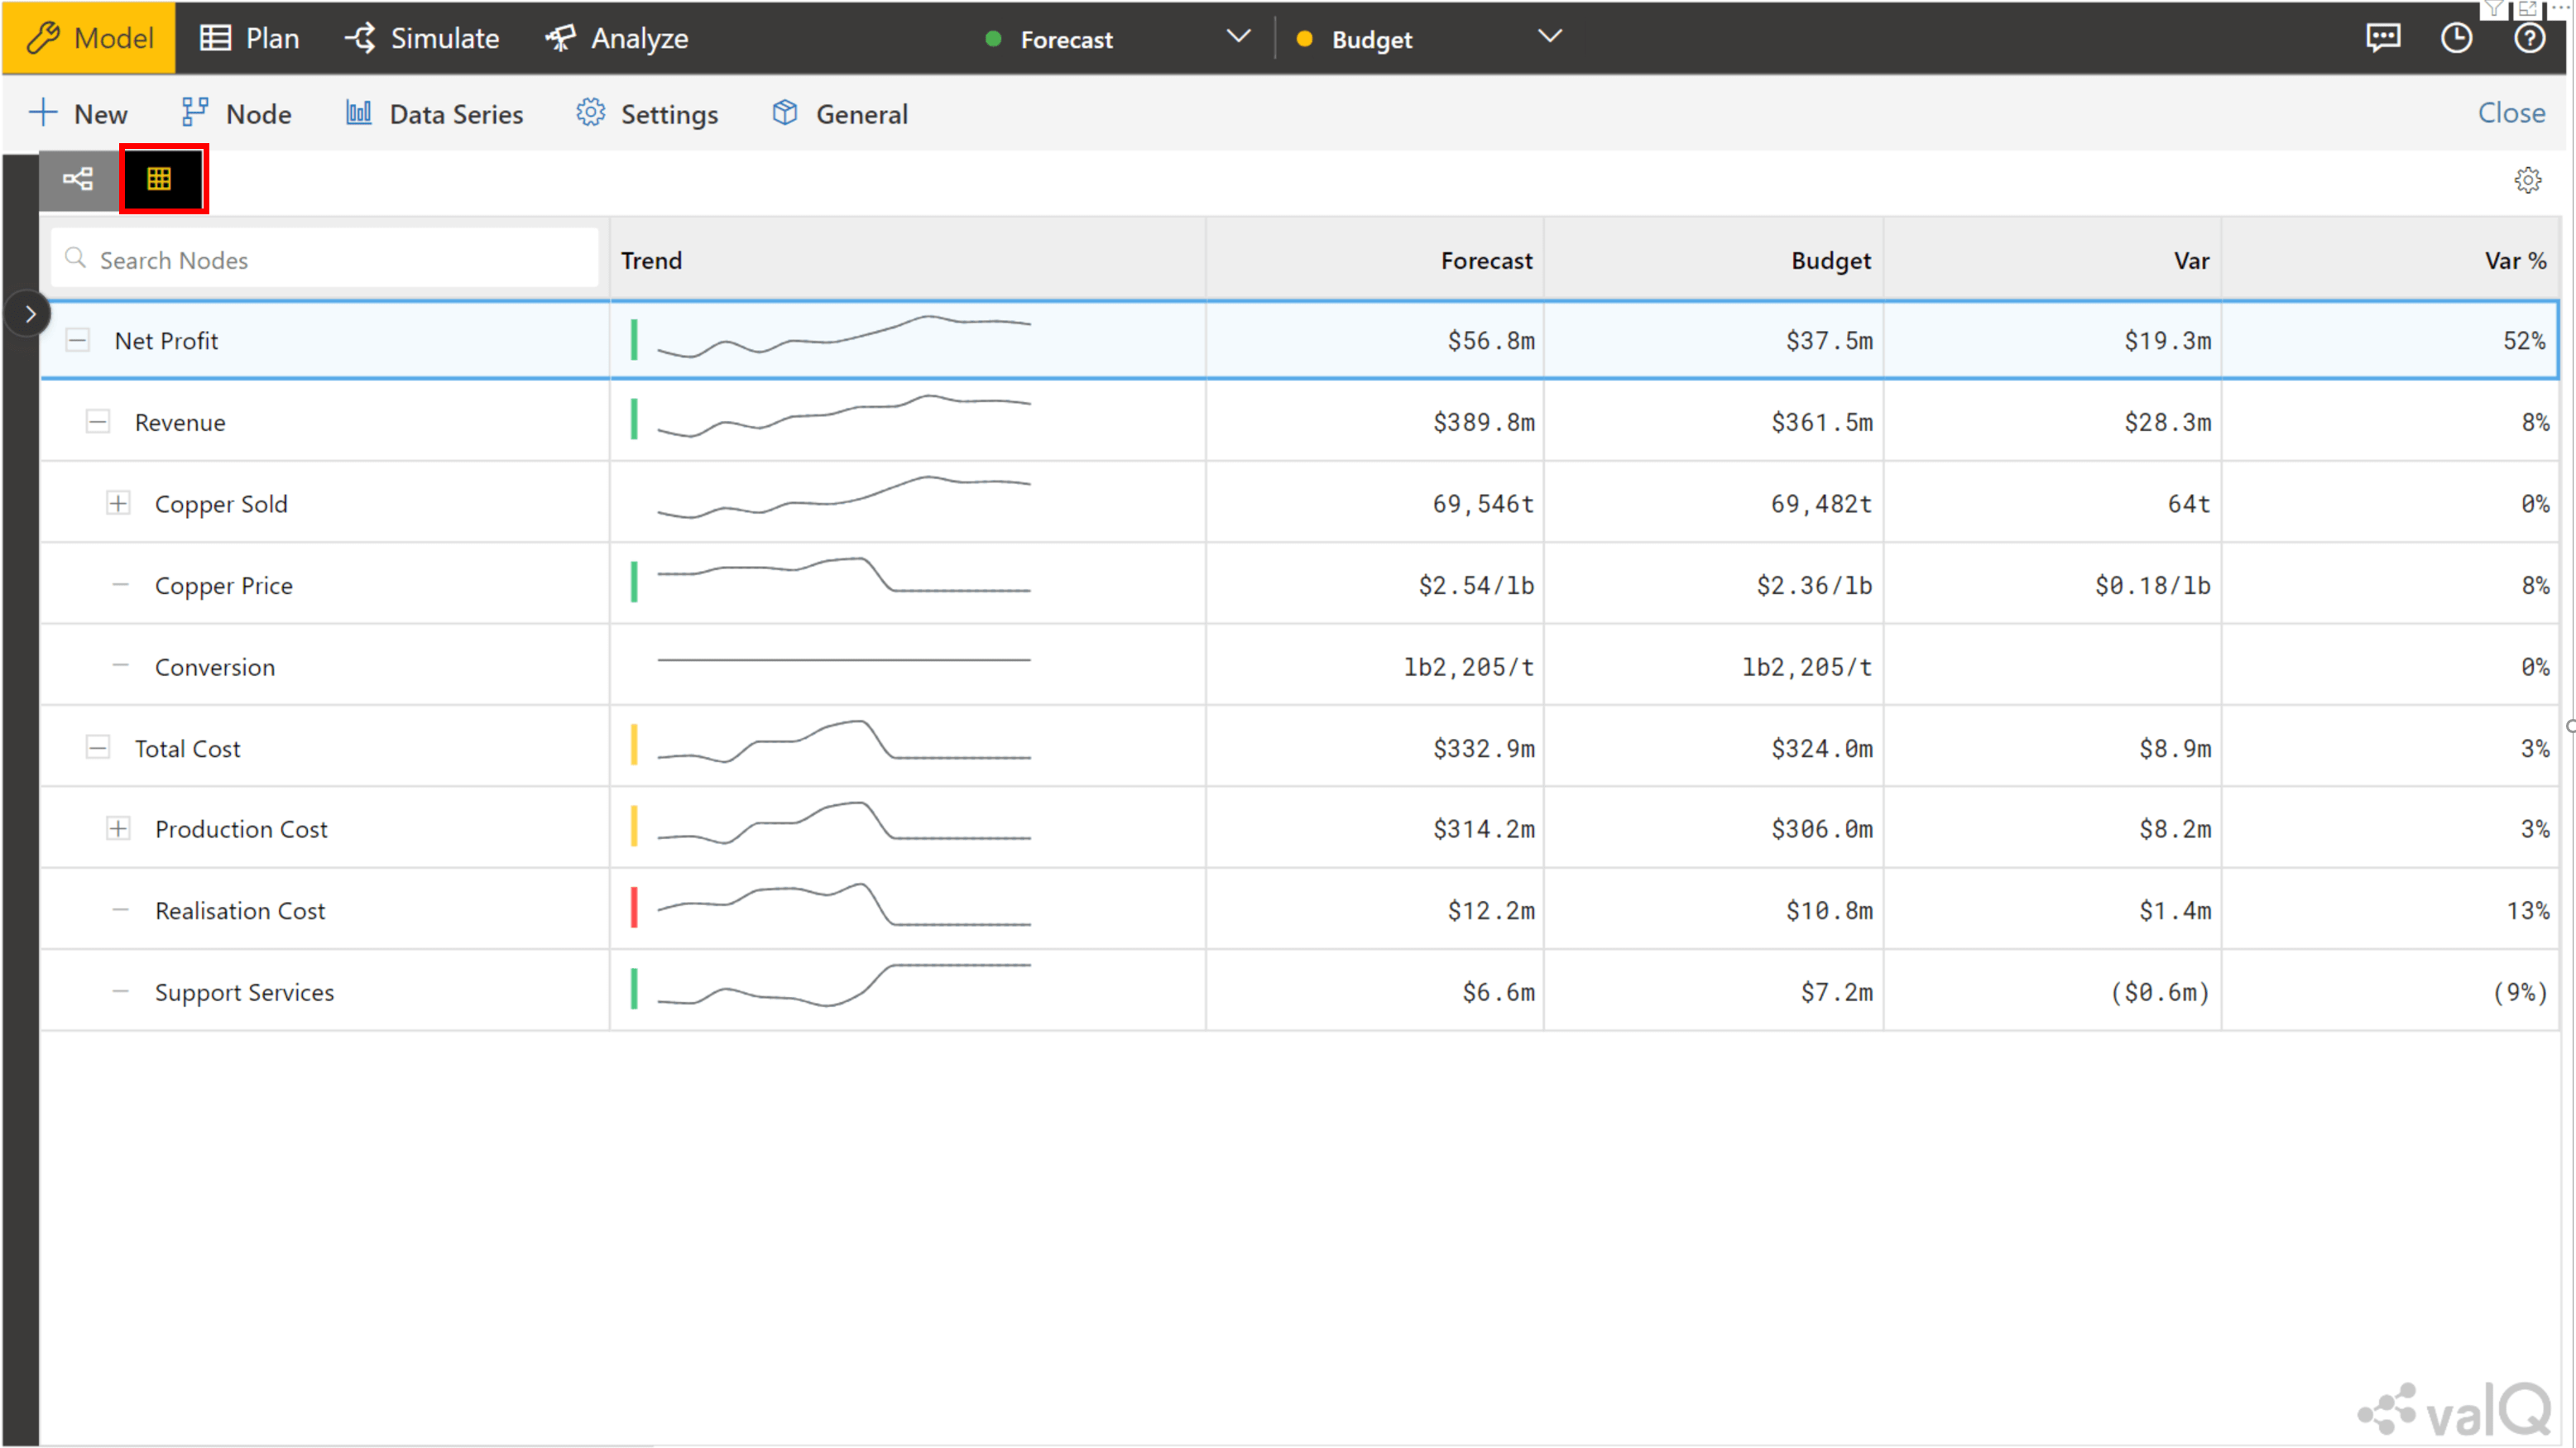
Here, the following actions can be performed:
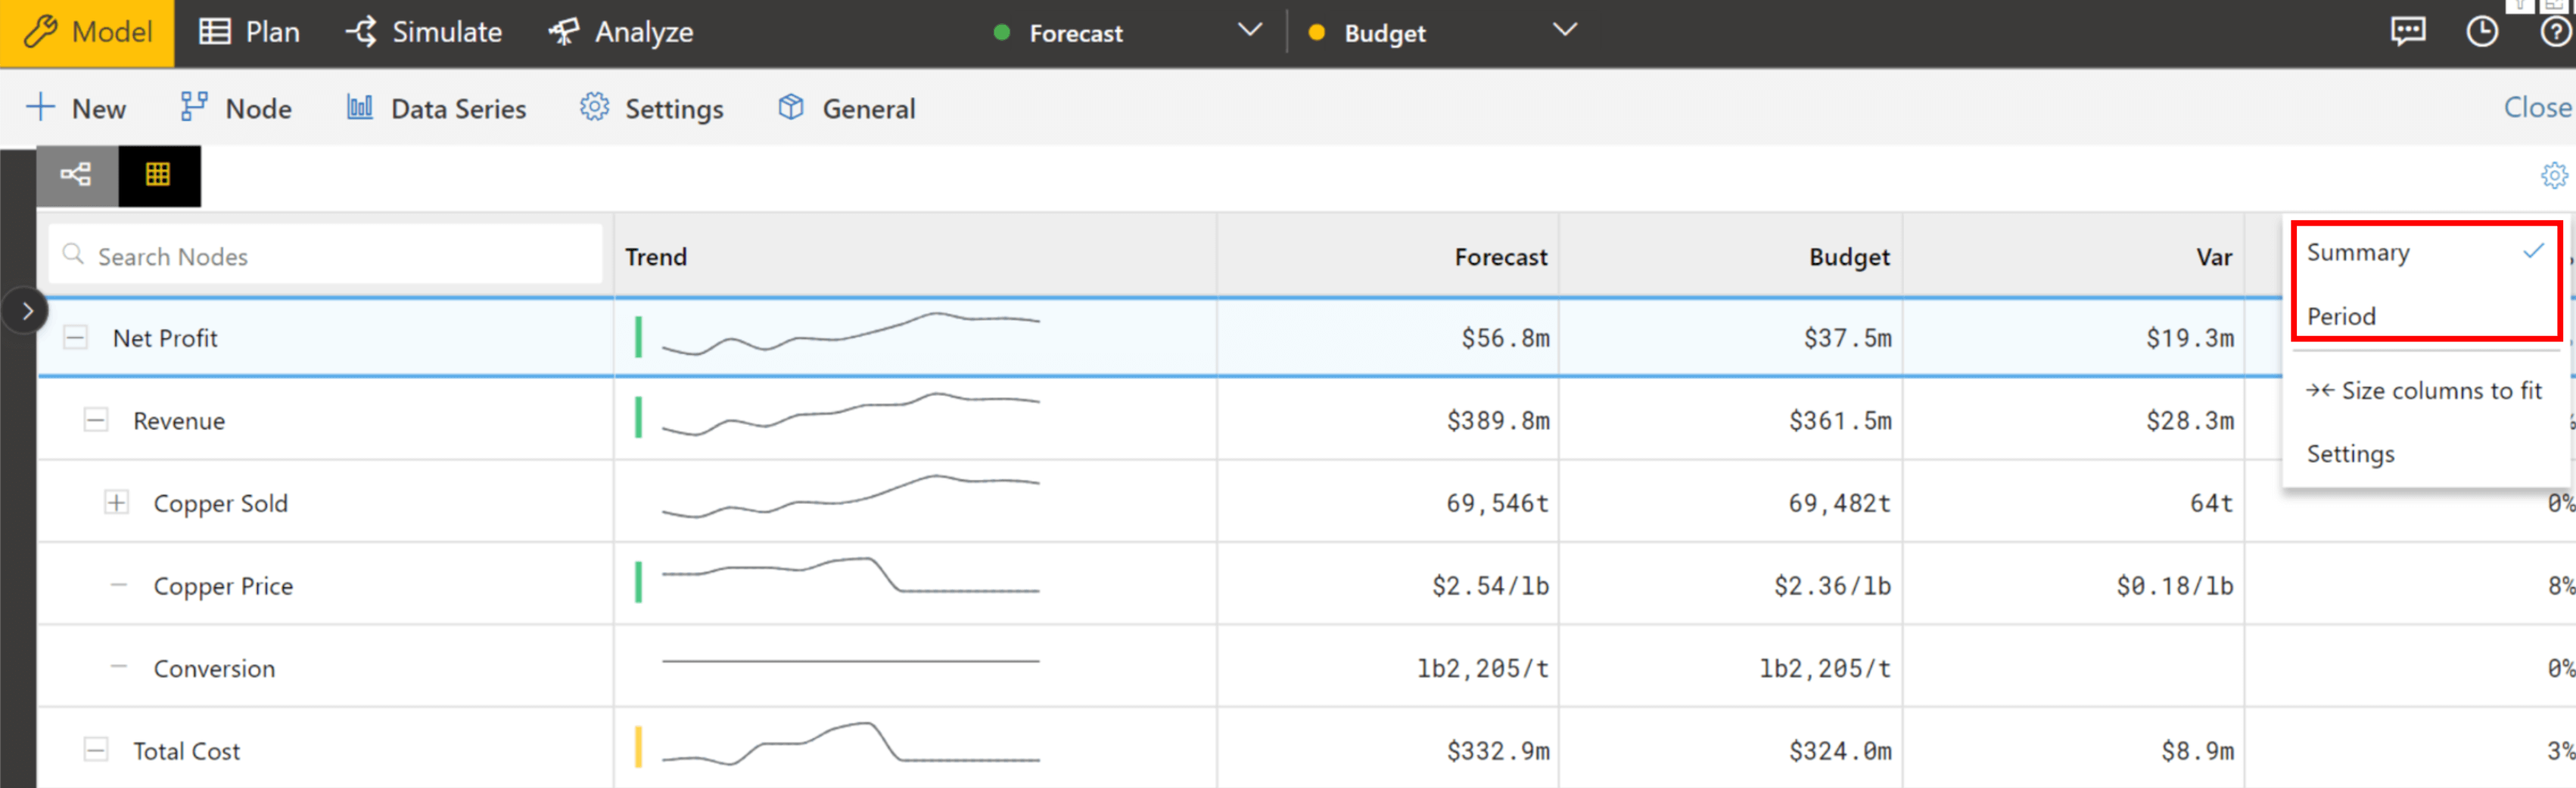
a.View Summary and Period Level Data
In ‘Settings’ icon, (i) the Summary of the entire data model can be chosen or
(ii) the Period level data can be chosen
b.Show/Hide Columns
In ‘Settings’, the columns can be chosen to be shown or hidden on user preference.

What’s new in ValQ 1.9?
With continuous improvements in mind, the latest release of ValQ 1.9 version comes with multiple updates and much-awaited performance enhancement attributes, for a better user experience. In this blog, let’s have a look at these upgrades and other brand-new features of Valq 1.9 in detail:
Features previously in Collaborate, now available in Certified Version:
- Attribution Analysis is now a part of the Certified Version (for Enterprise Plan). For more insights on Attribution Analysis click here.
- Zero Based Budgeting in the Plan Tab has been included in this version. To know more about Zero Based Budgeting on ValQ click here.
New Feature Updates:
1.Table View
It is now possible to view your Data Model in a Table View, in addition to the already existing Tree View. Consider this example of a P&L Model. Click on the ‘Table View’ icon for your model to display in a table format.

Here, the following actions can be performed:
a.View Summary and Period Level Data
In ‘Settings’ icon, (i) the Summary of the entire data model can be chosen or
(ii) the Period level data can be chosen

b.Show/Hide Columns
In ‘Settings’, the columns can be chosen to be shown or hidden on user preference.

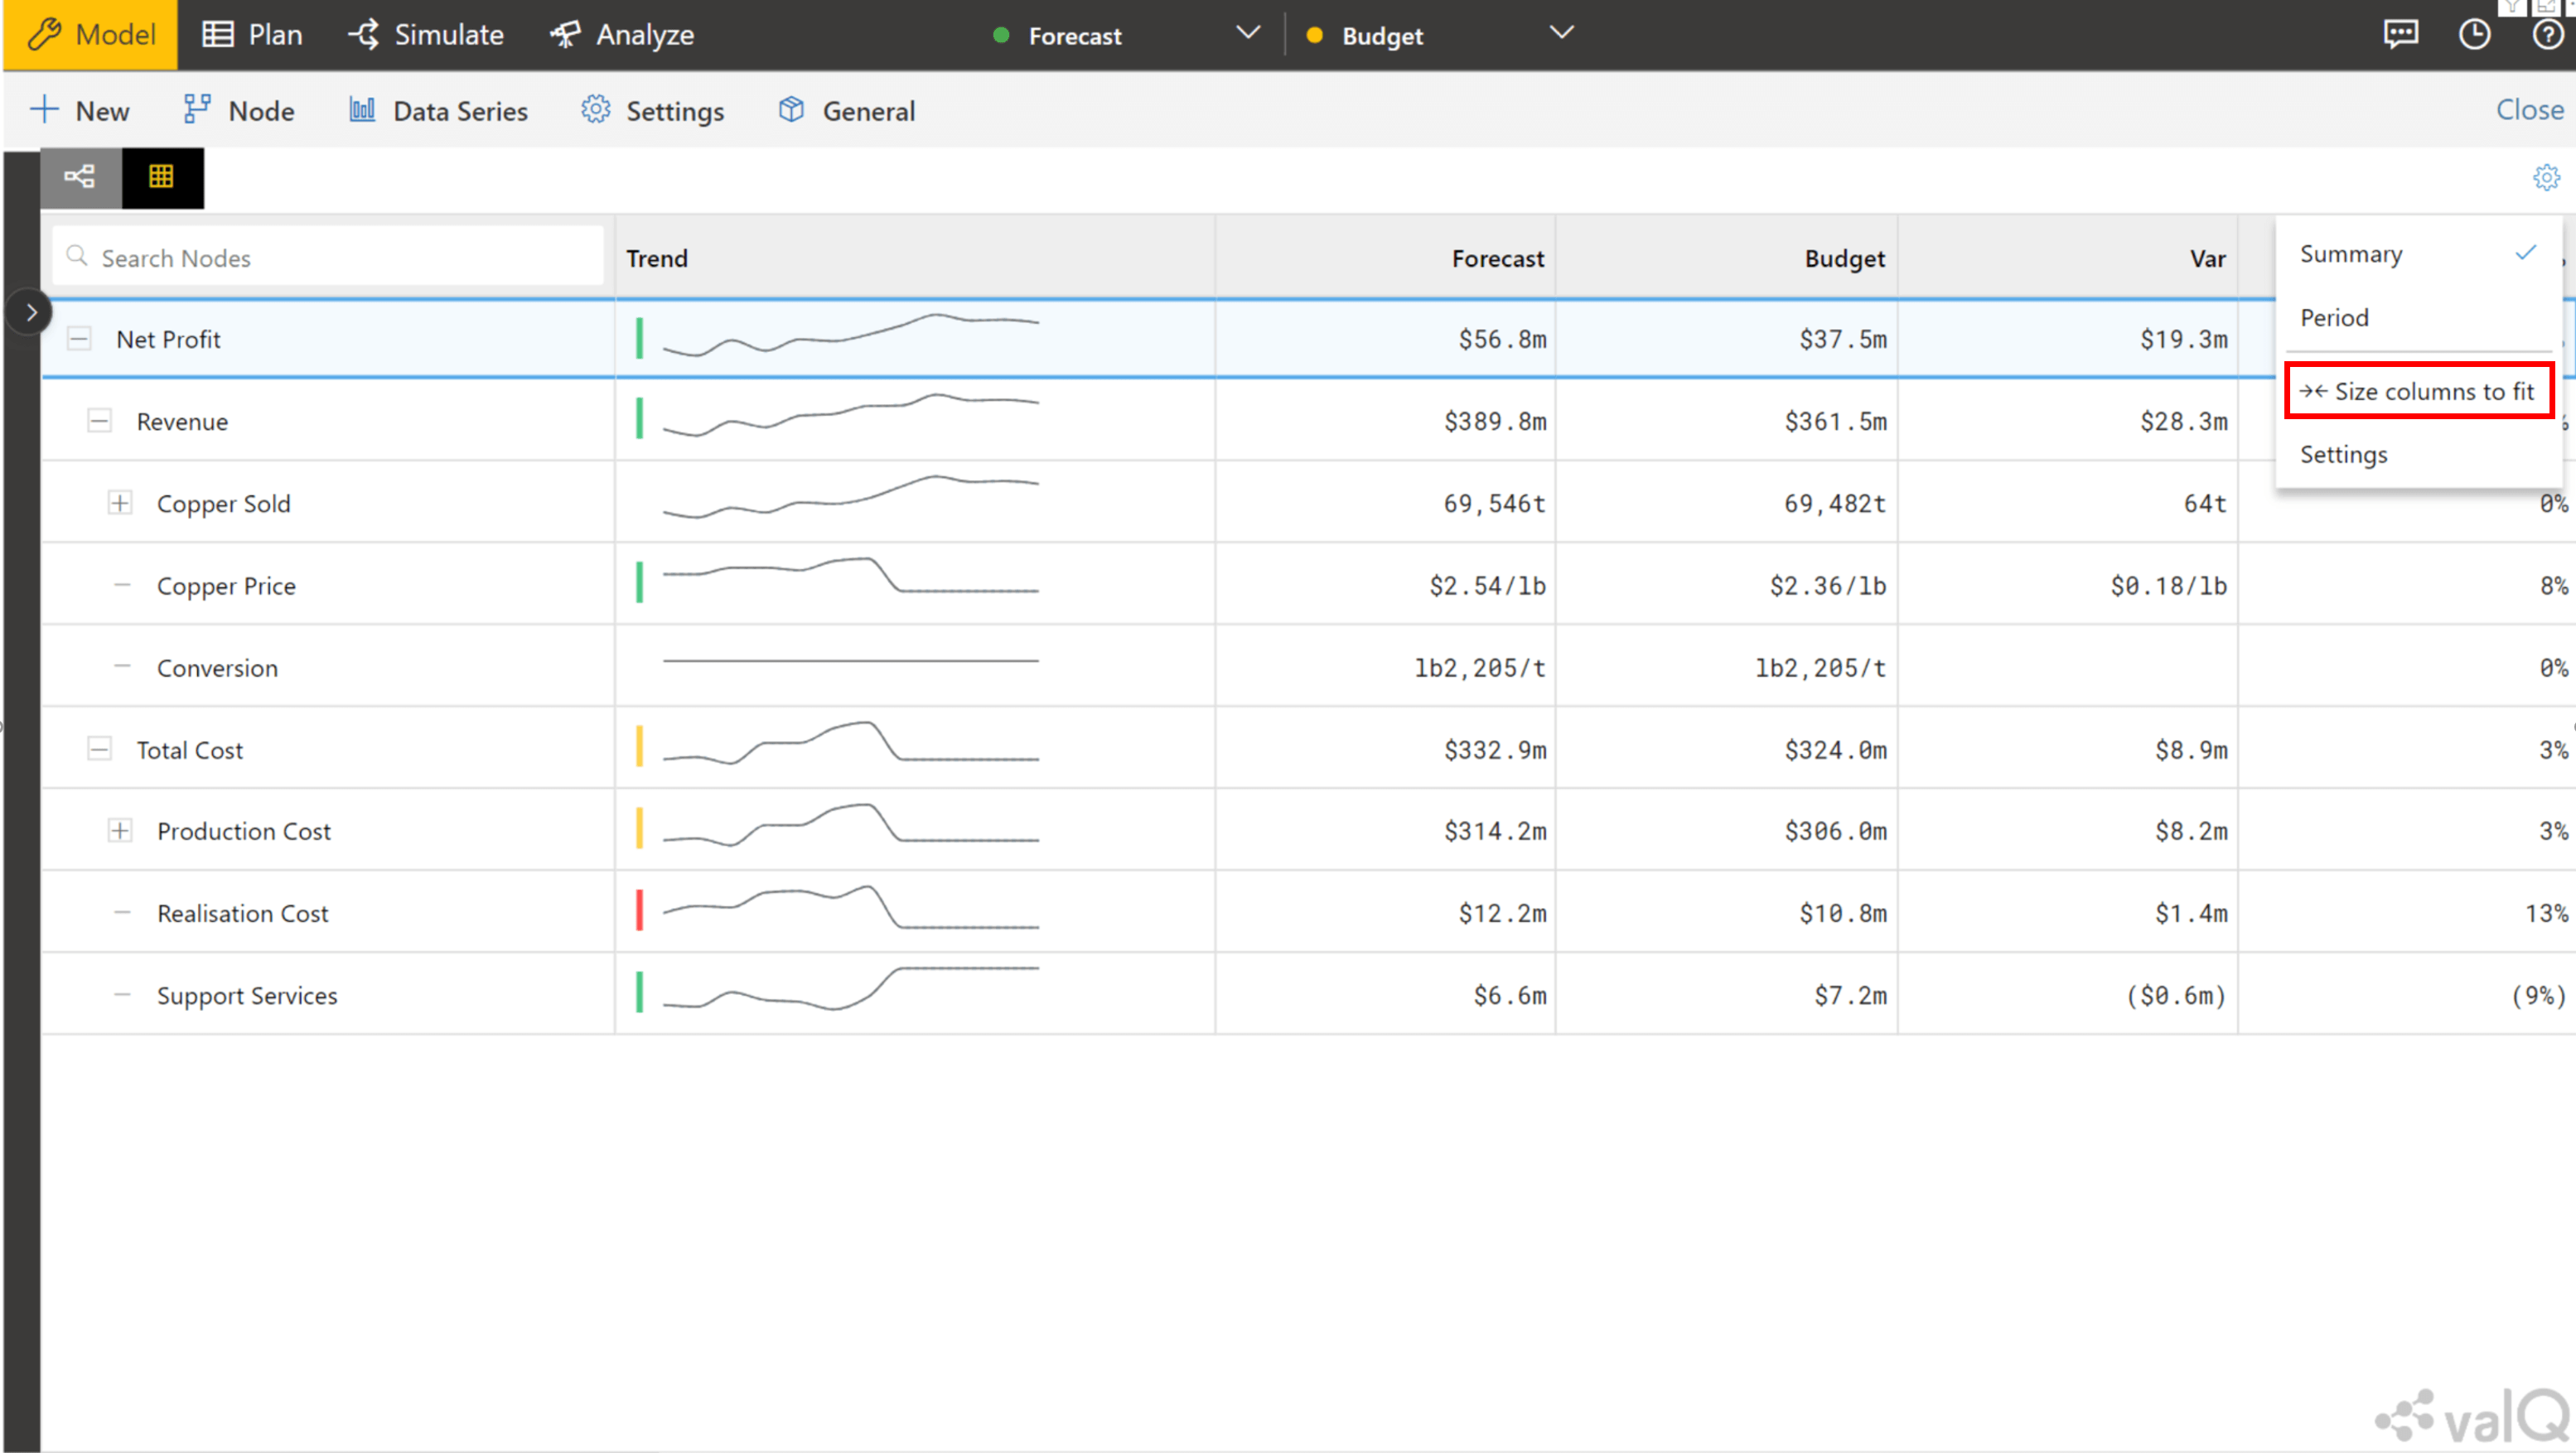
2. Grids Resize Functionality
In this latest update, we can choose to see all the columns of the Data Model within the Table View, at one glace.
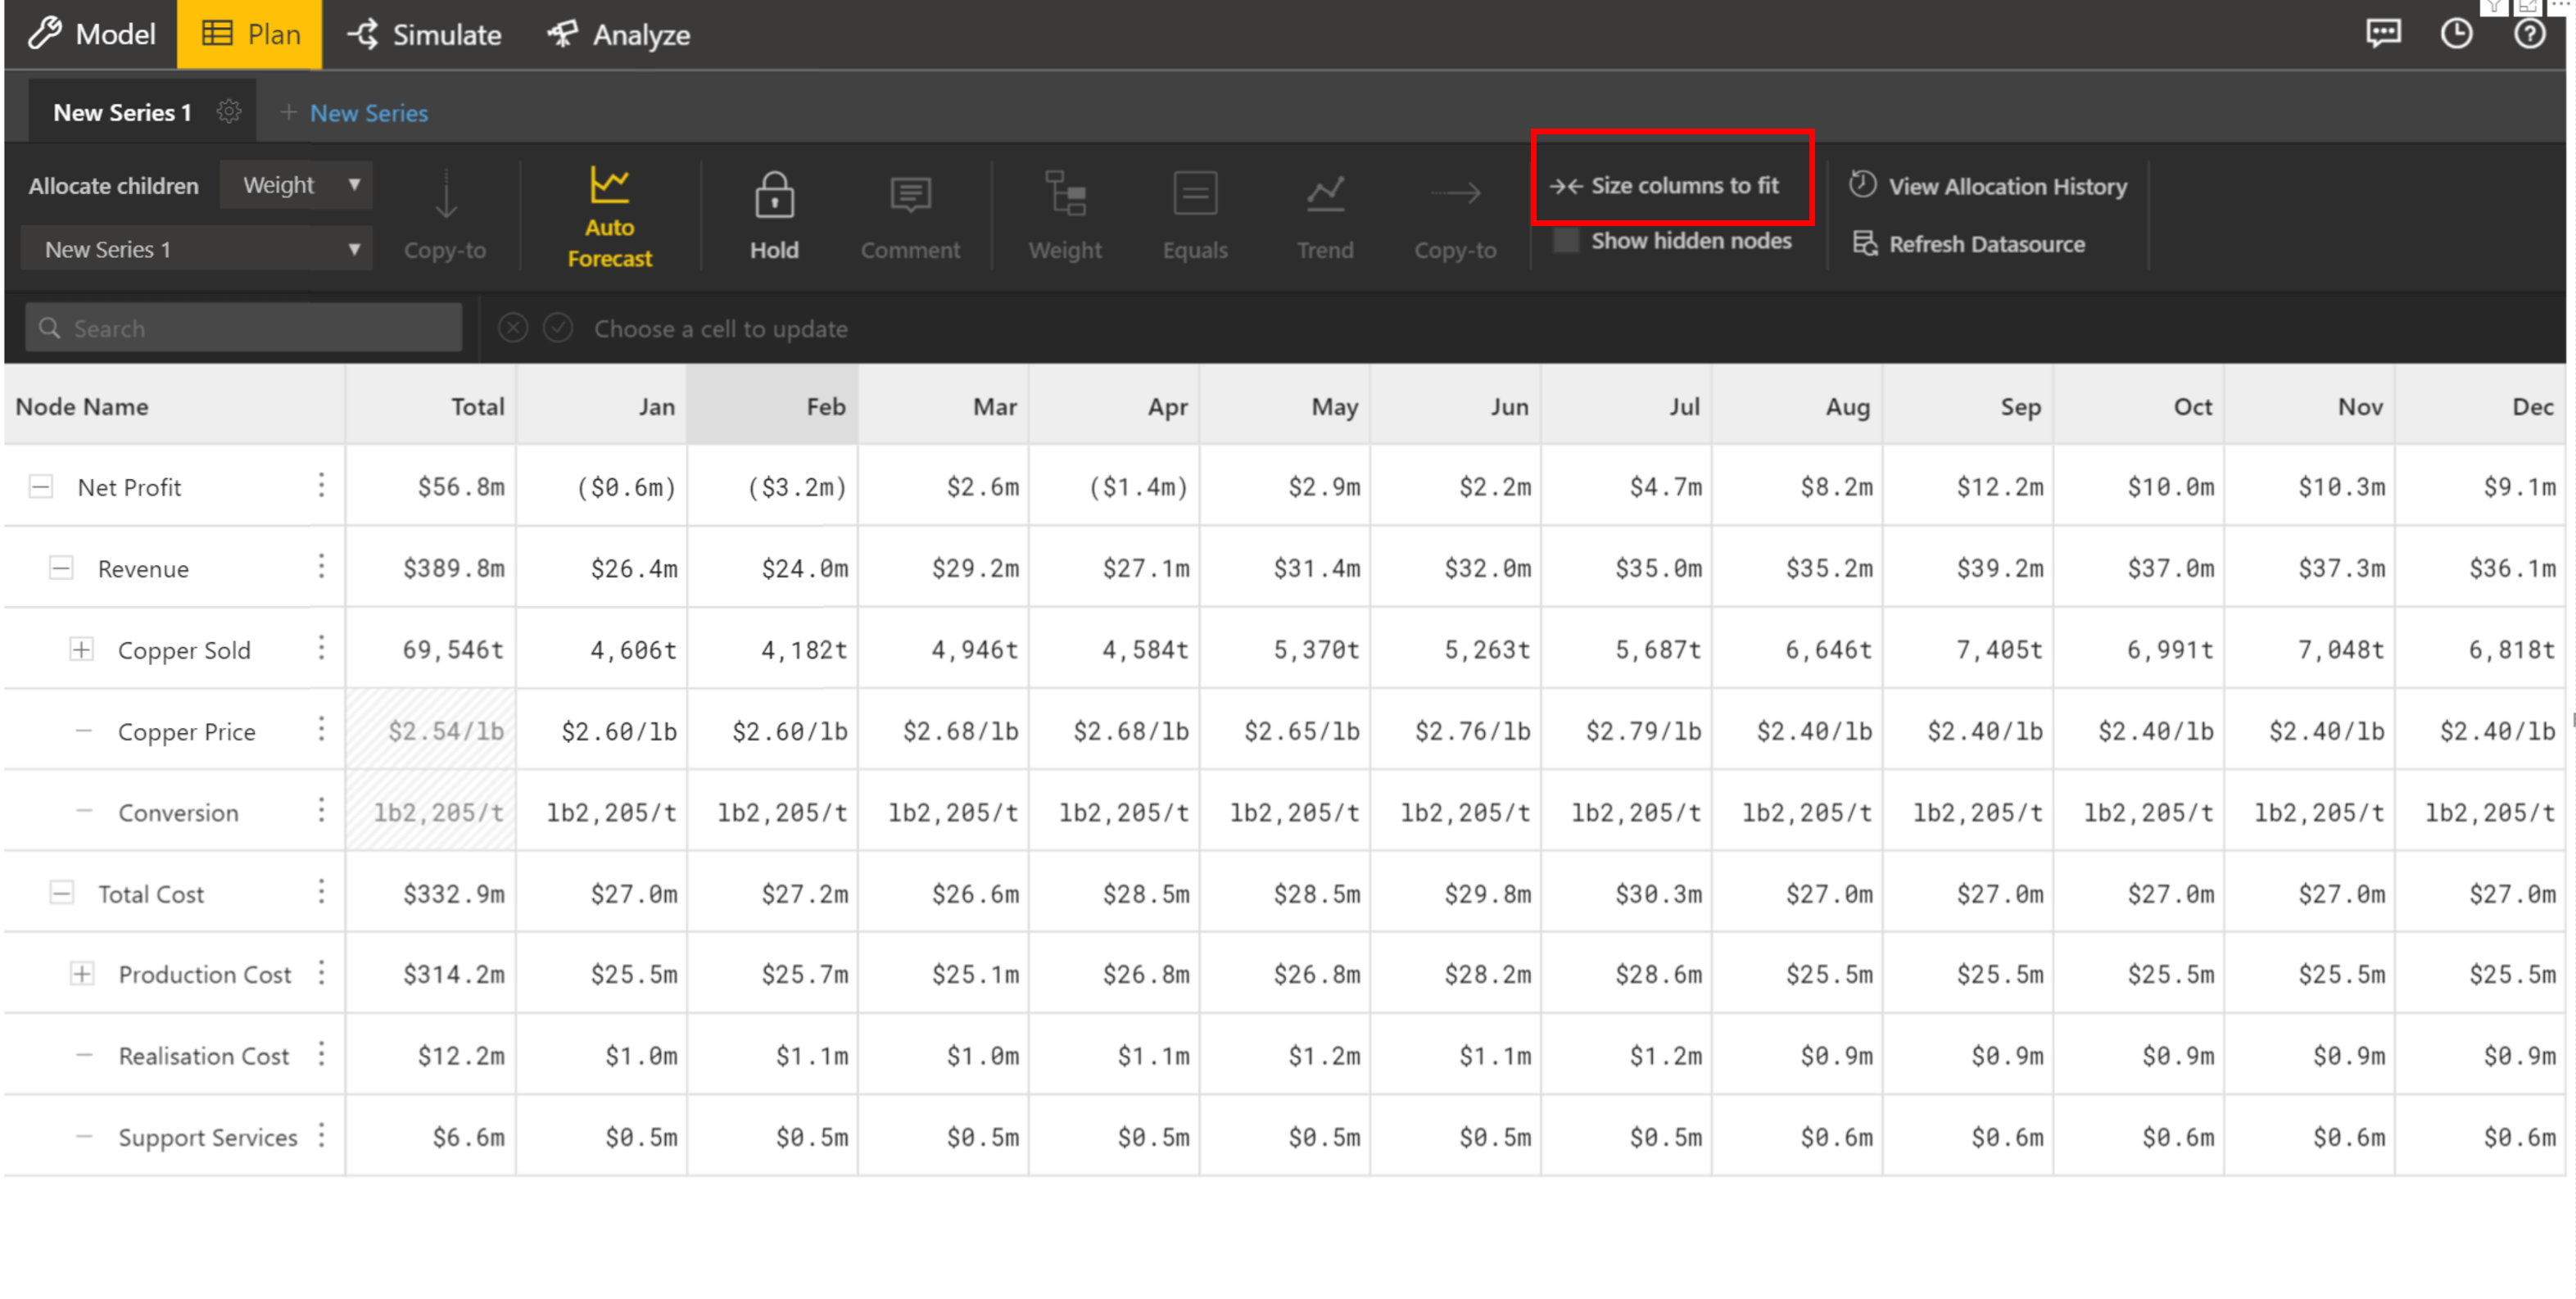
Select ‘Settings’ icon and choose ‘Size Columns to fit’. This enables all the columns of the model to be fit in the same page.
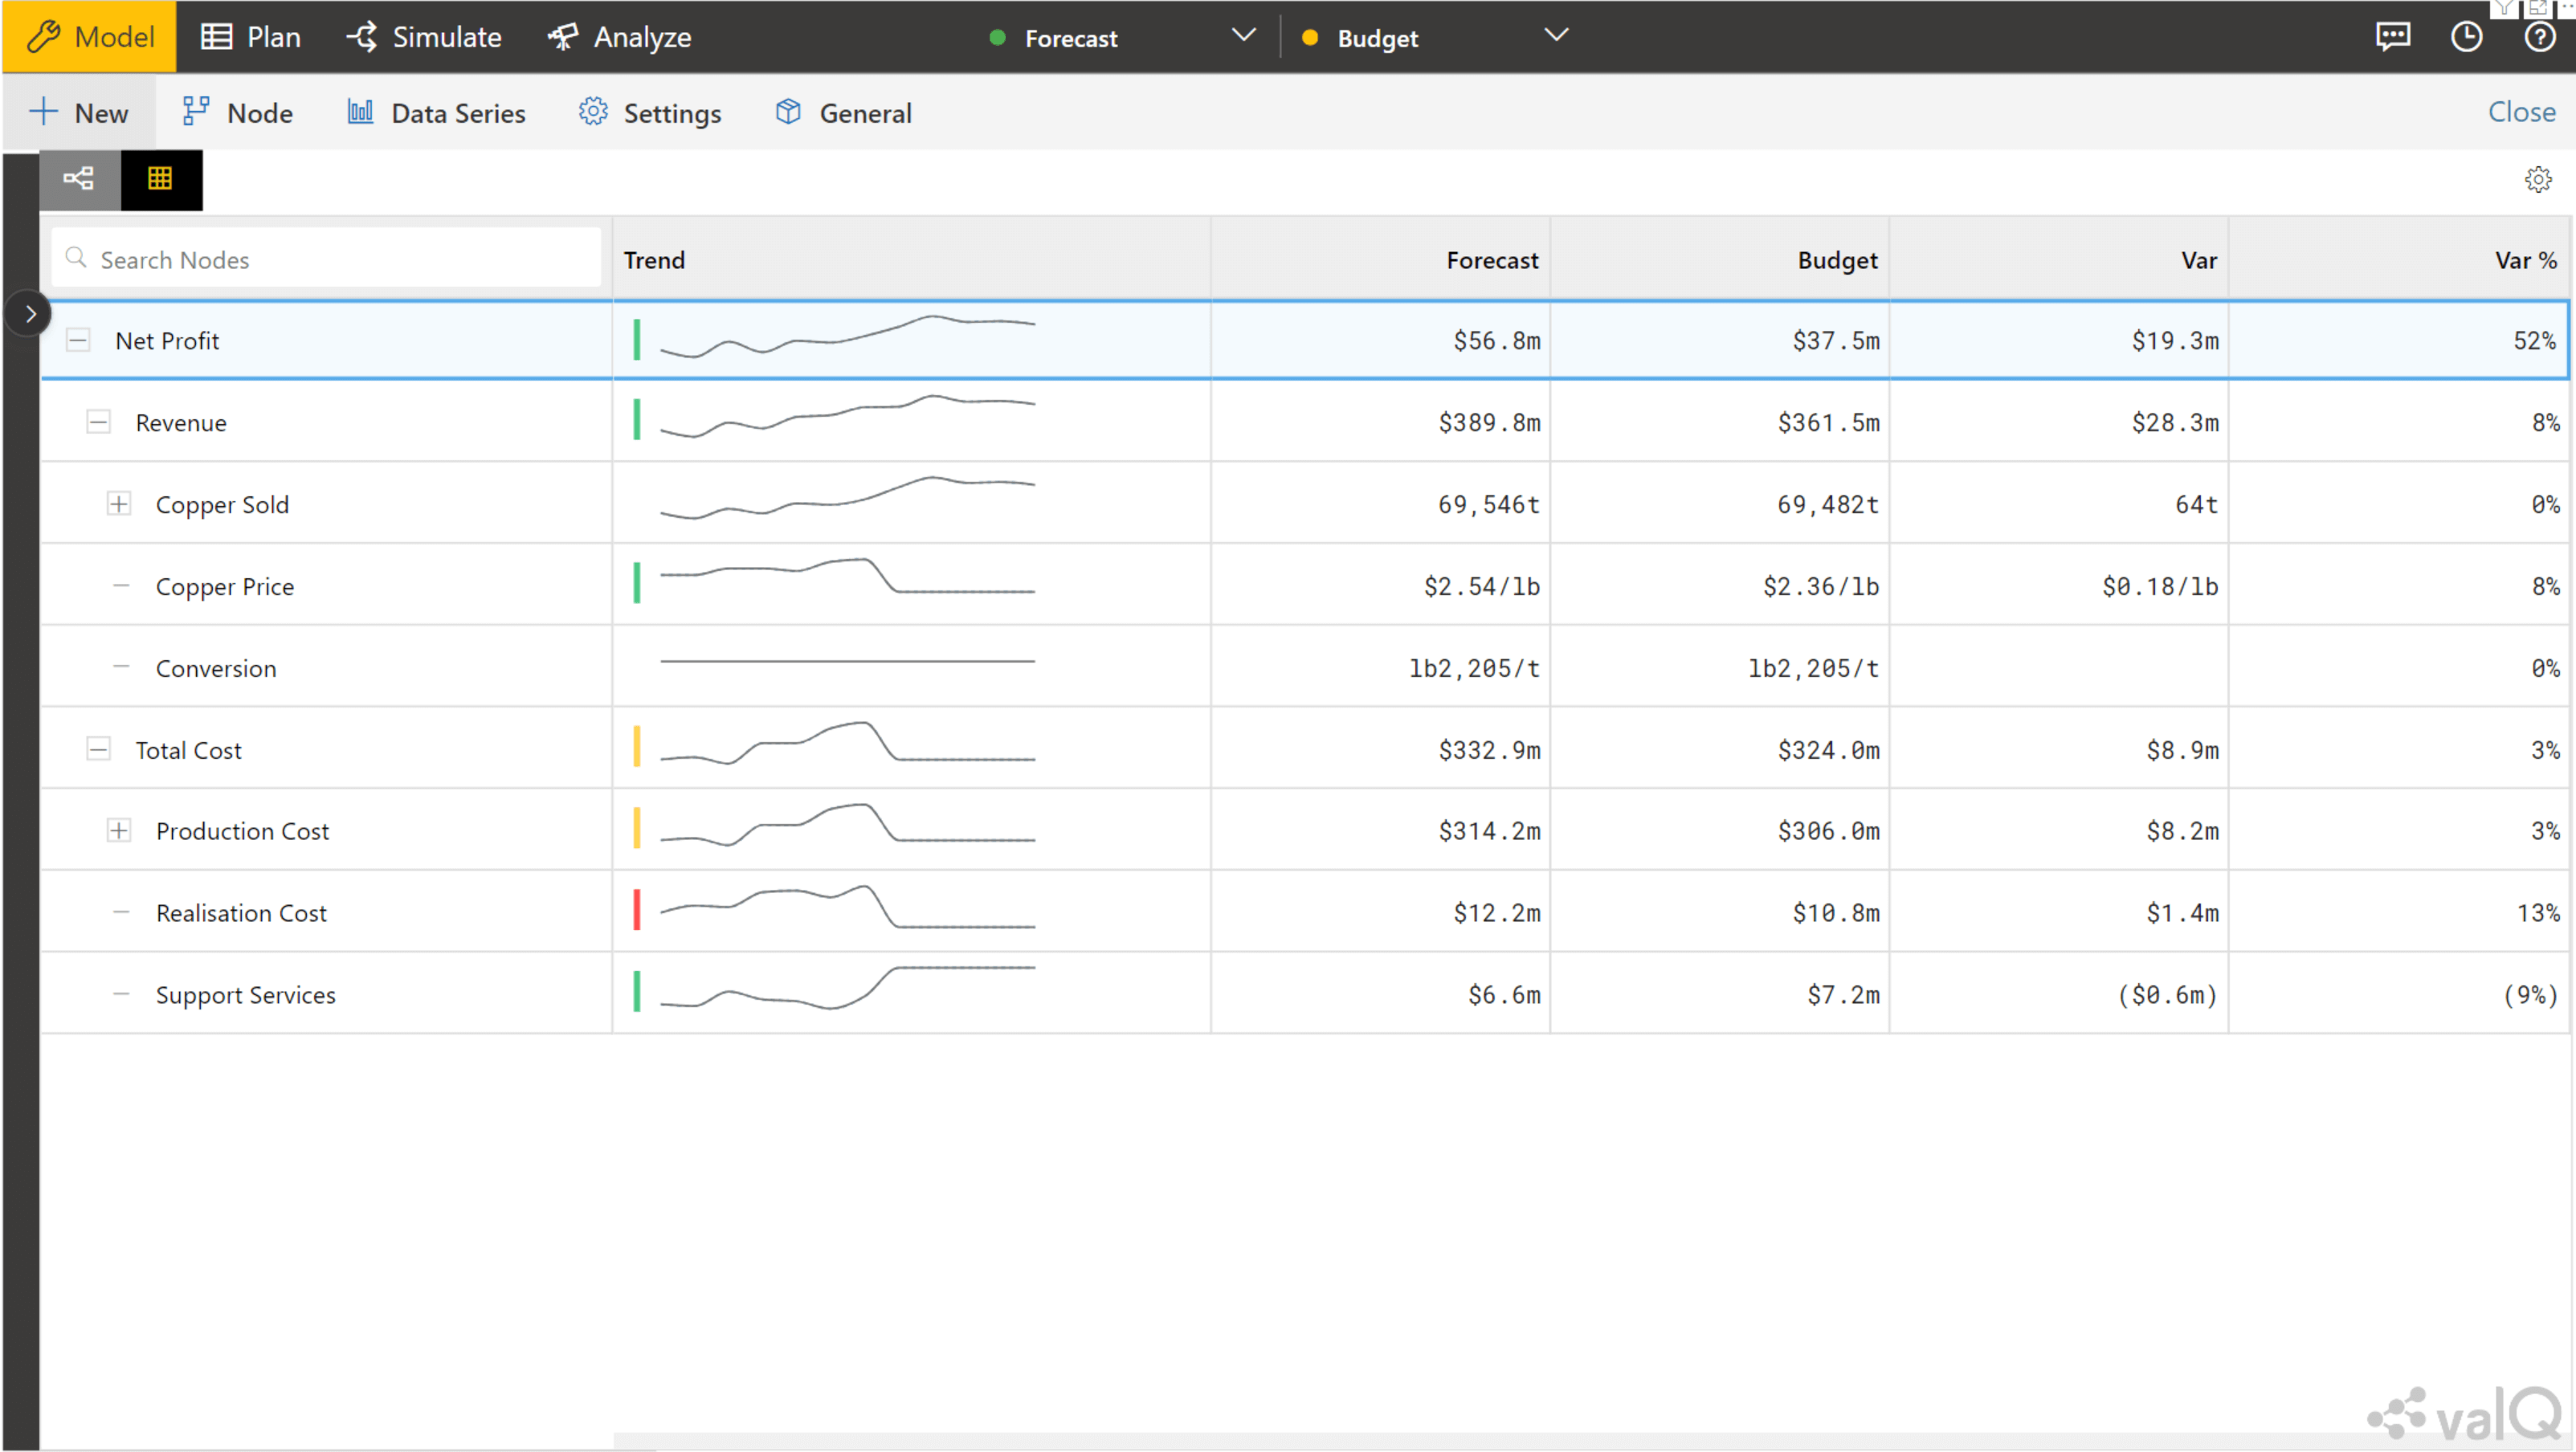
In addition to the Table View, Grid Resize Functionality also applies for the Plan Tab and Variance Analysis Tab.
Plan Tab:
Here, choose ‘Size Columns to Fit’. In this model, all the months can be viewed at one glance.
Variance Analysis Tab:
In the ‘Variance Analysis’ tab, choose ‘Size Columns to fit’ for all the data to appear in the same screen.

3. Secondary KPI for table
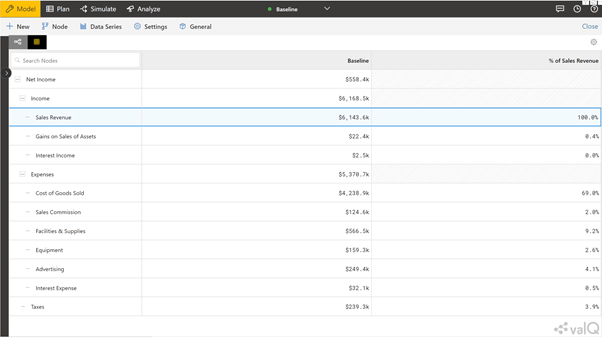
In this new update, we can have the Secondary KPI displayed as a part of the Table View when the data model is displayed.
In this P&L Model, Common Size analysis can be done by calculating the ‘% of Sales Revenue’ for each node as the Secondary KPI.
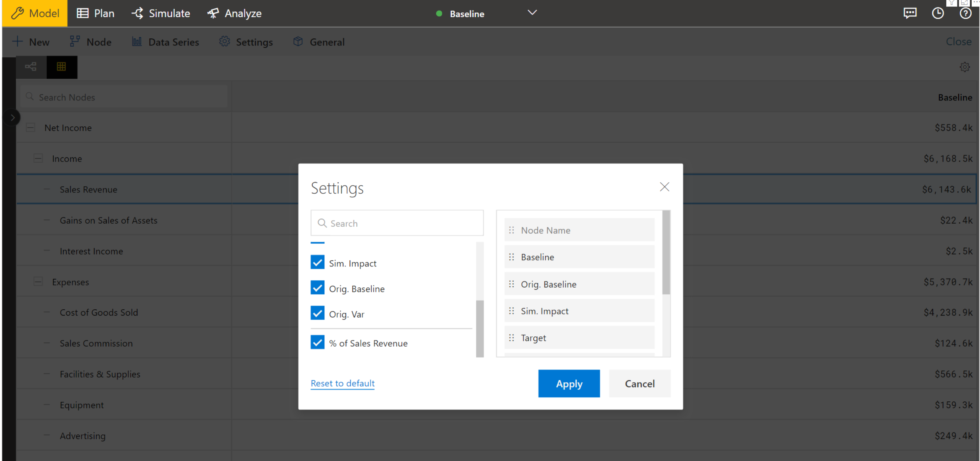
Now, select ‘Settings’ in the Table View. A small pop-up screen will appear. Here, you can choose ‘% of Sales Revenue’ and give ‘Apply’.
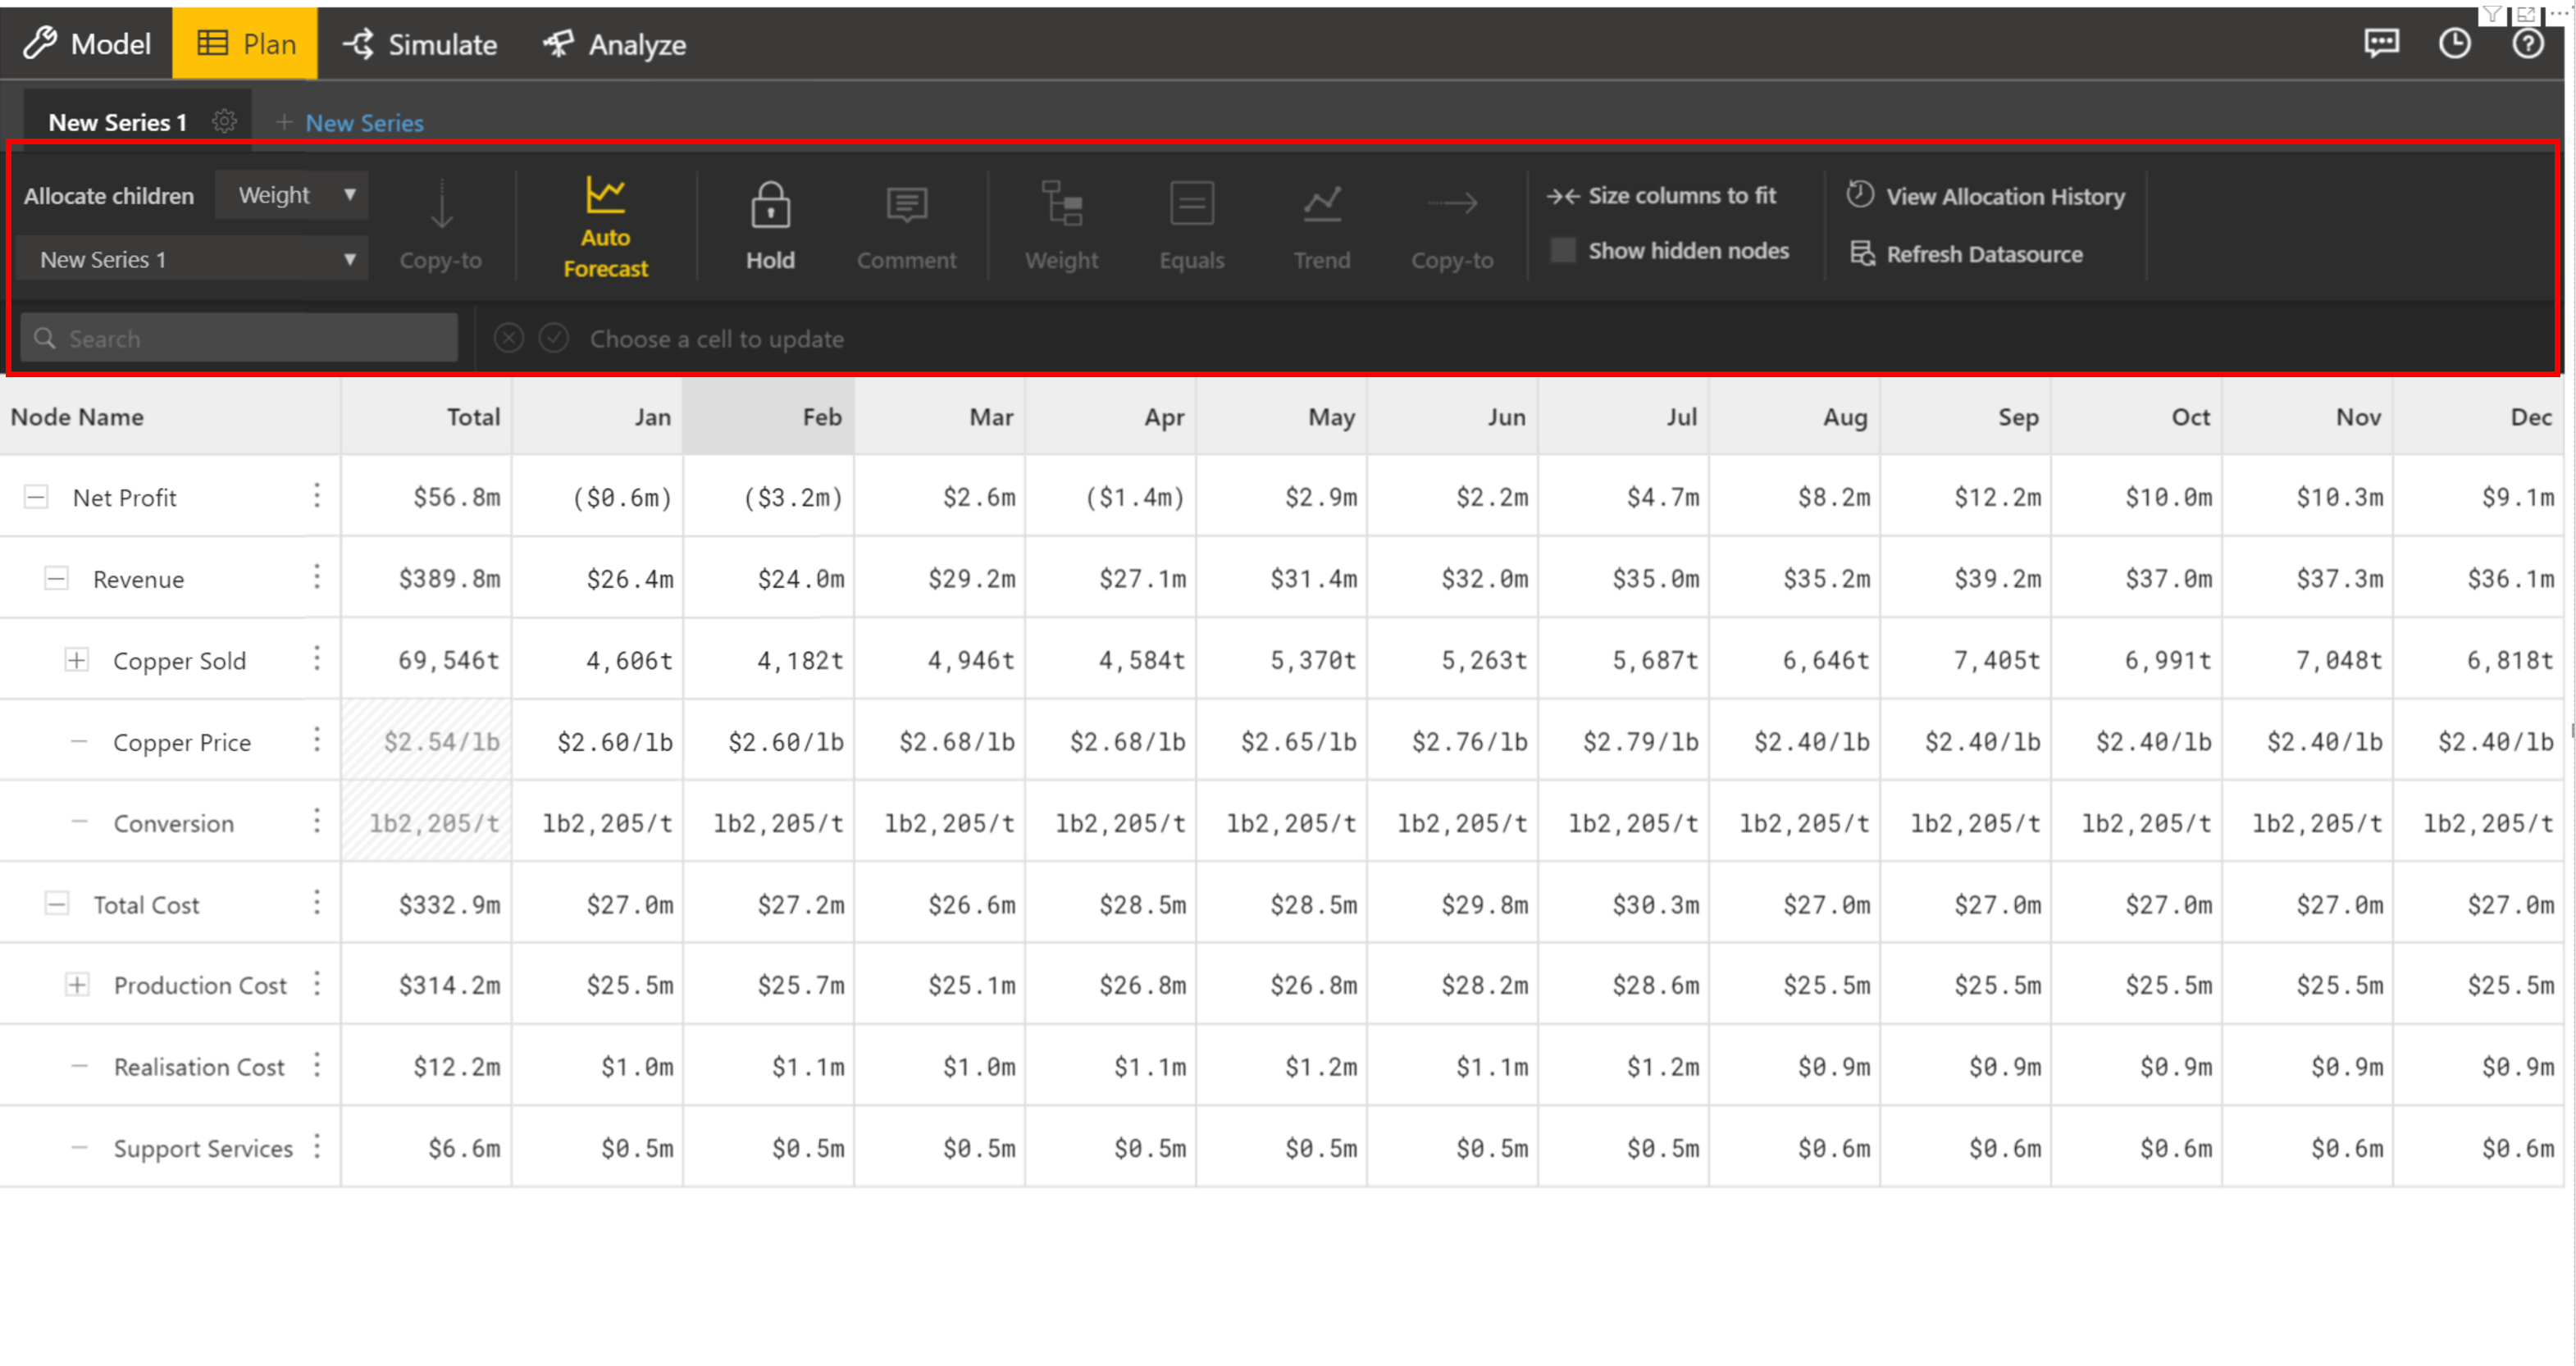
4. Tool Bar Changes
Planning Toolbar has undergone display changes with the UI considering the user experience in mind. Tools and options are now upgraded and placed at convenient positions for ease of use.
Similarly, in the Variance Analysis Tool Bar, there have been changes made for ease of use.
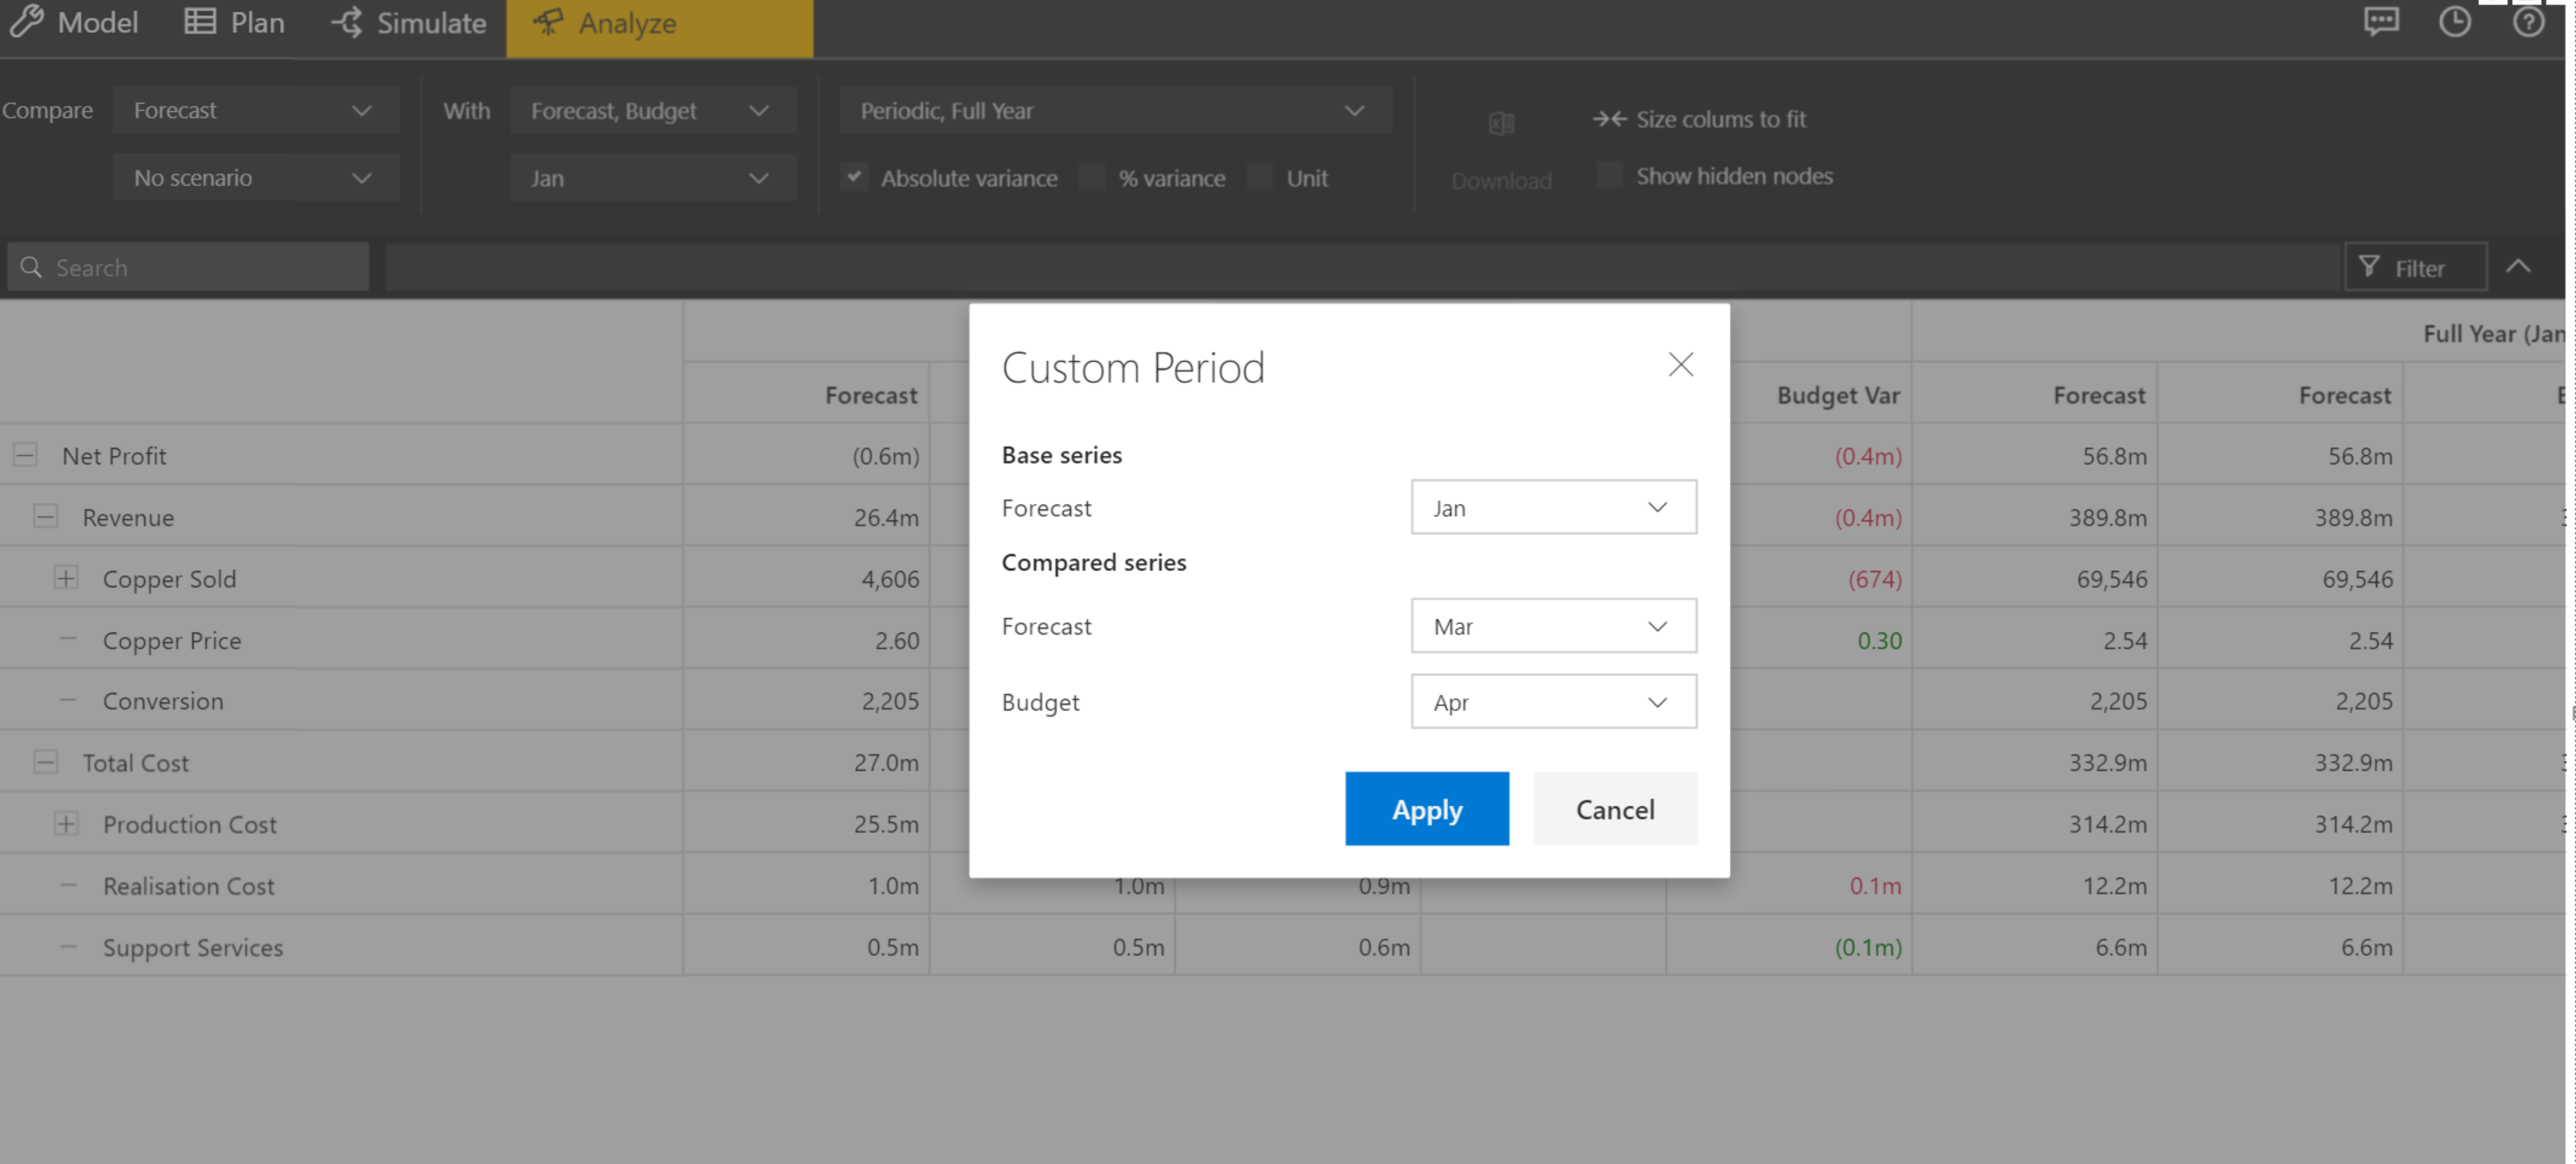
In addition to that, under Variance Analysis, the Time Period can be customized along with the Data Series based on user’s preference.
Choose ‘Custom’, for the time period. Here, only the chosen Data Series will appear, for which the time period can be chosen as one desires like Jan, Mar, Apr in this case.
5.Other Feature Fixes:
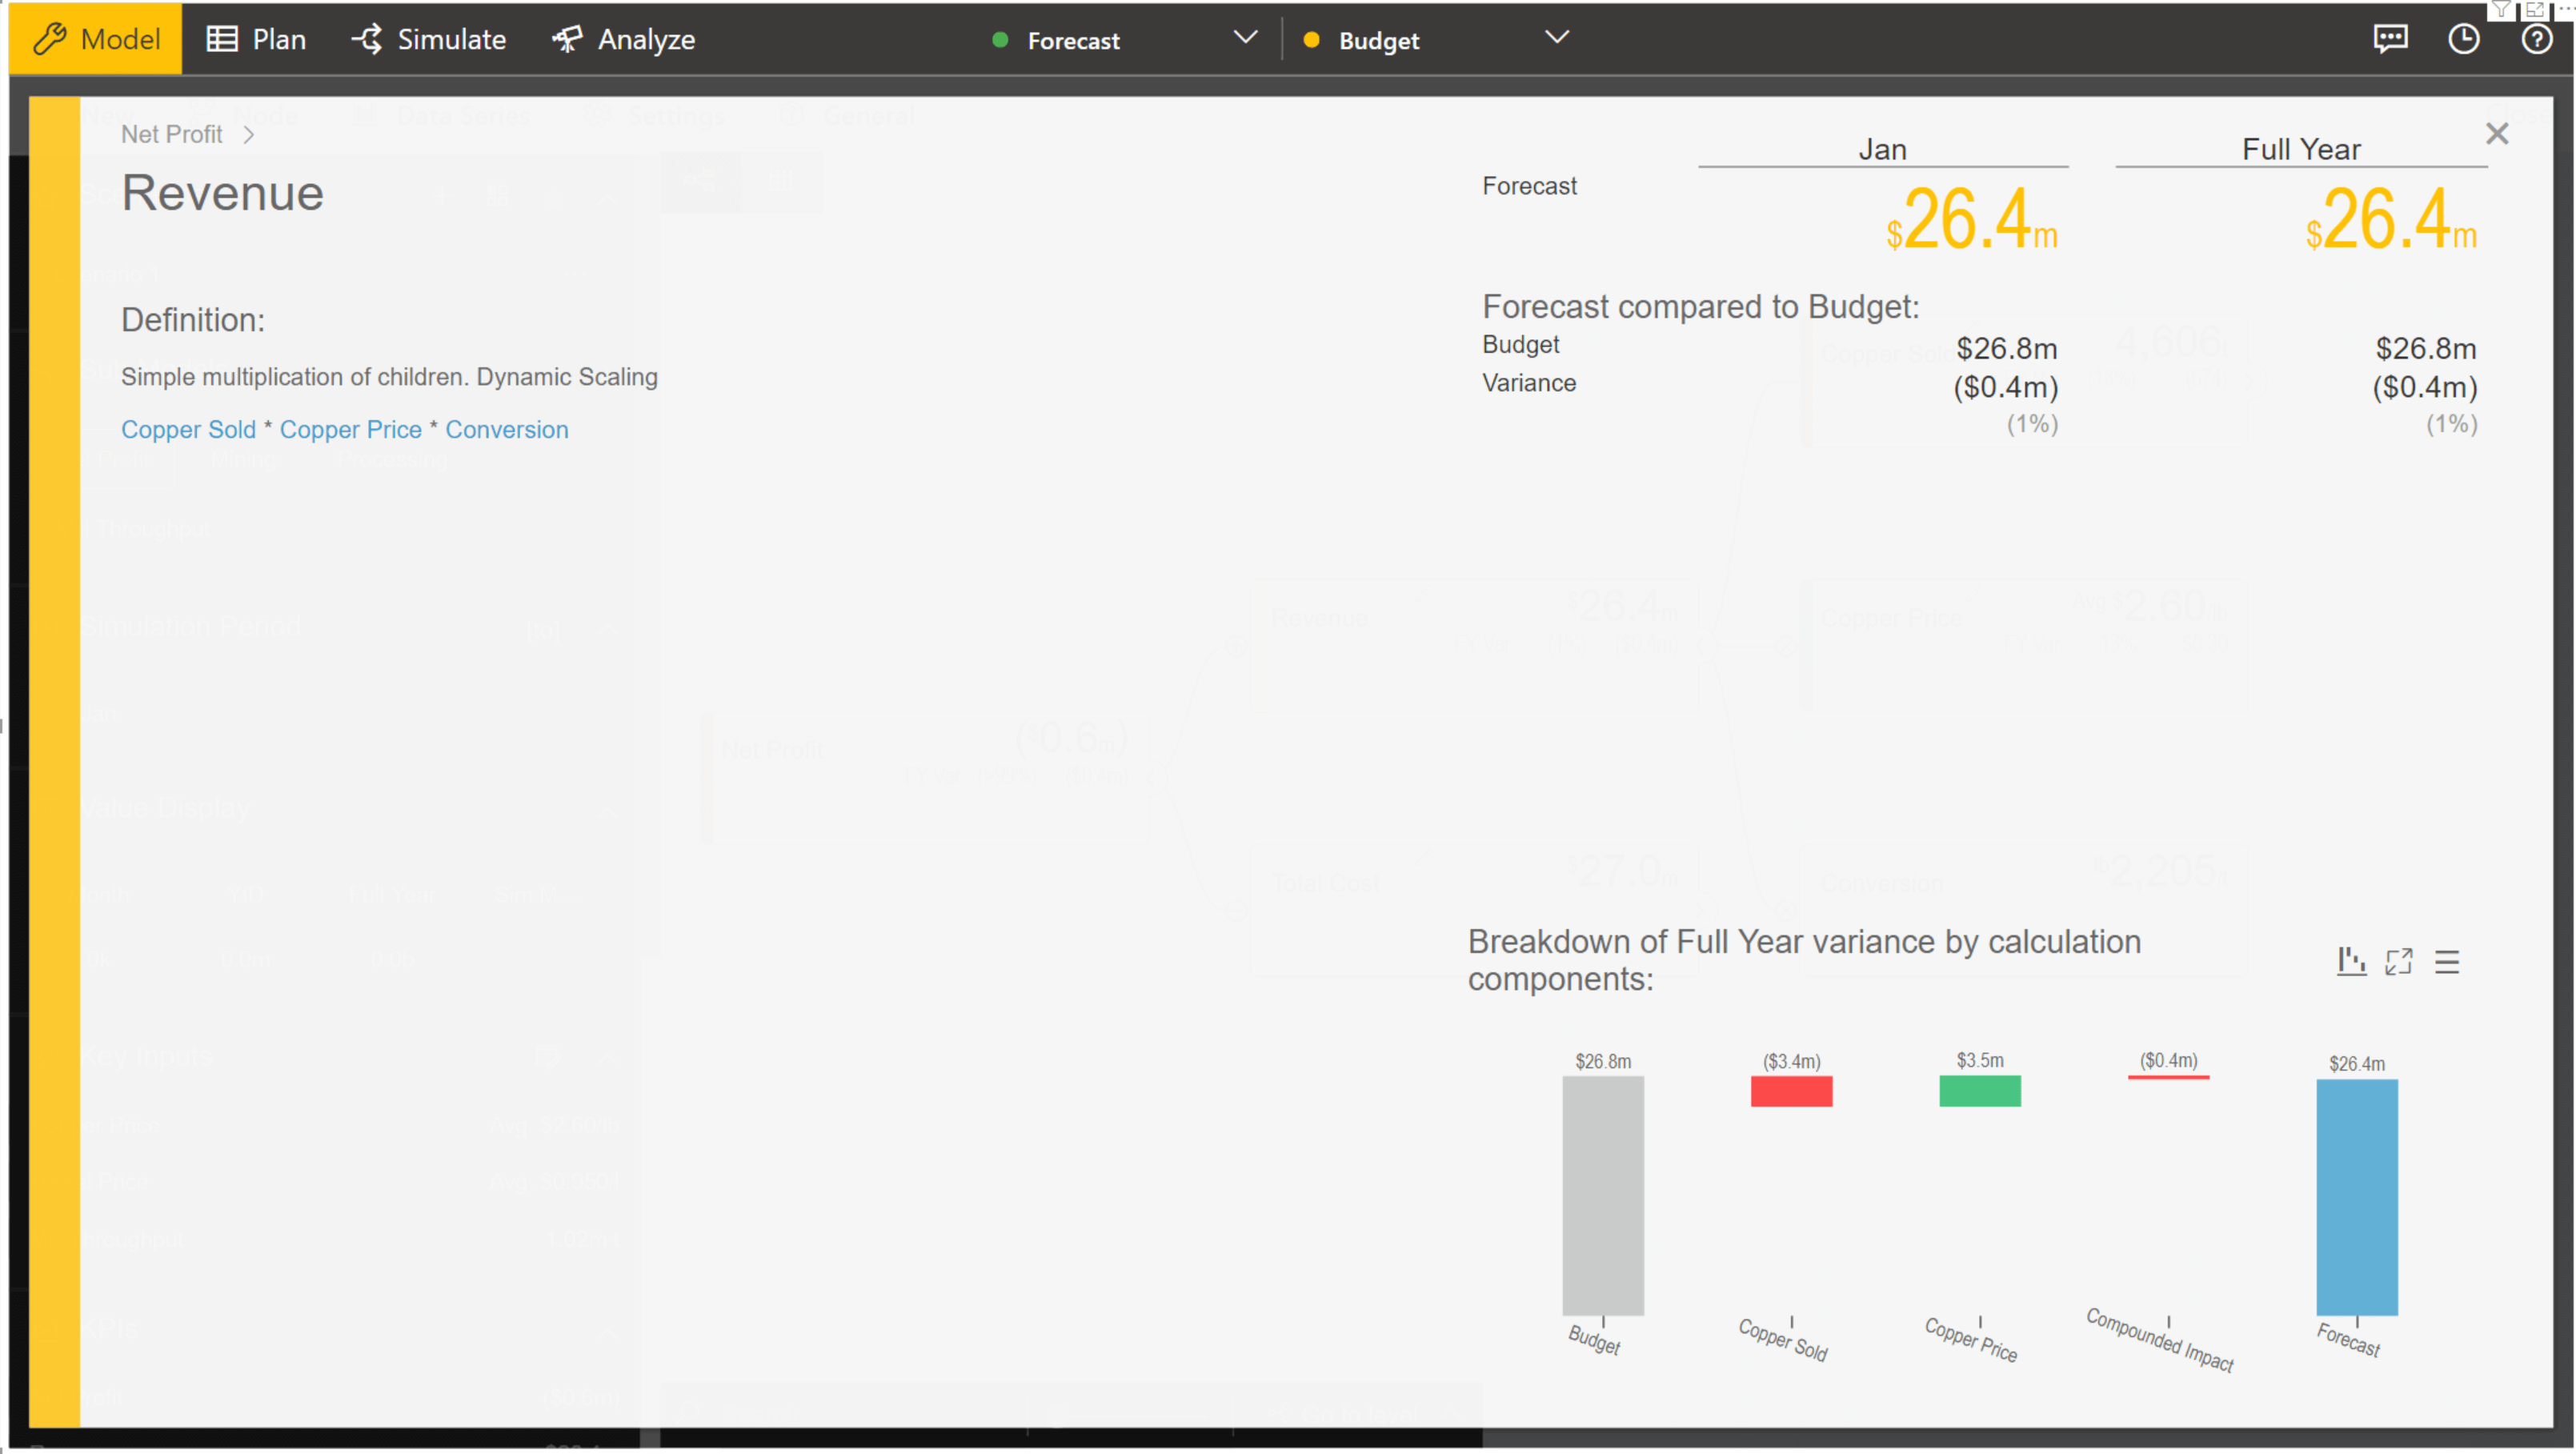
a.If the Data Model has only one period, then the trend column will be hidden in the Pop-Up Screen, when any node is selected.
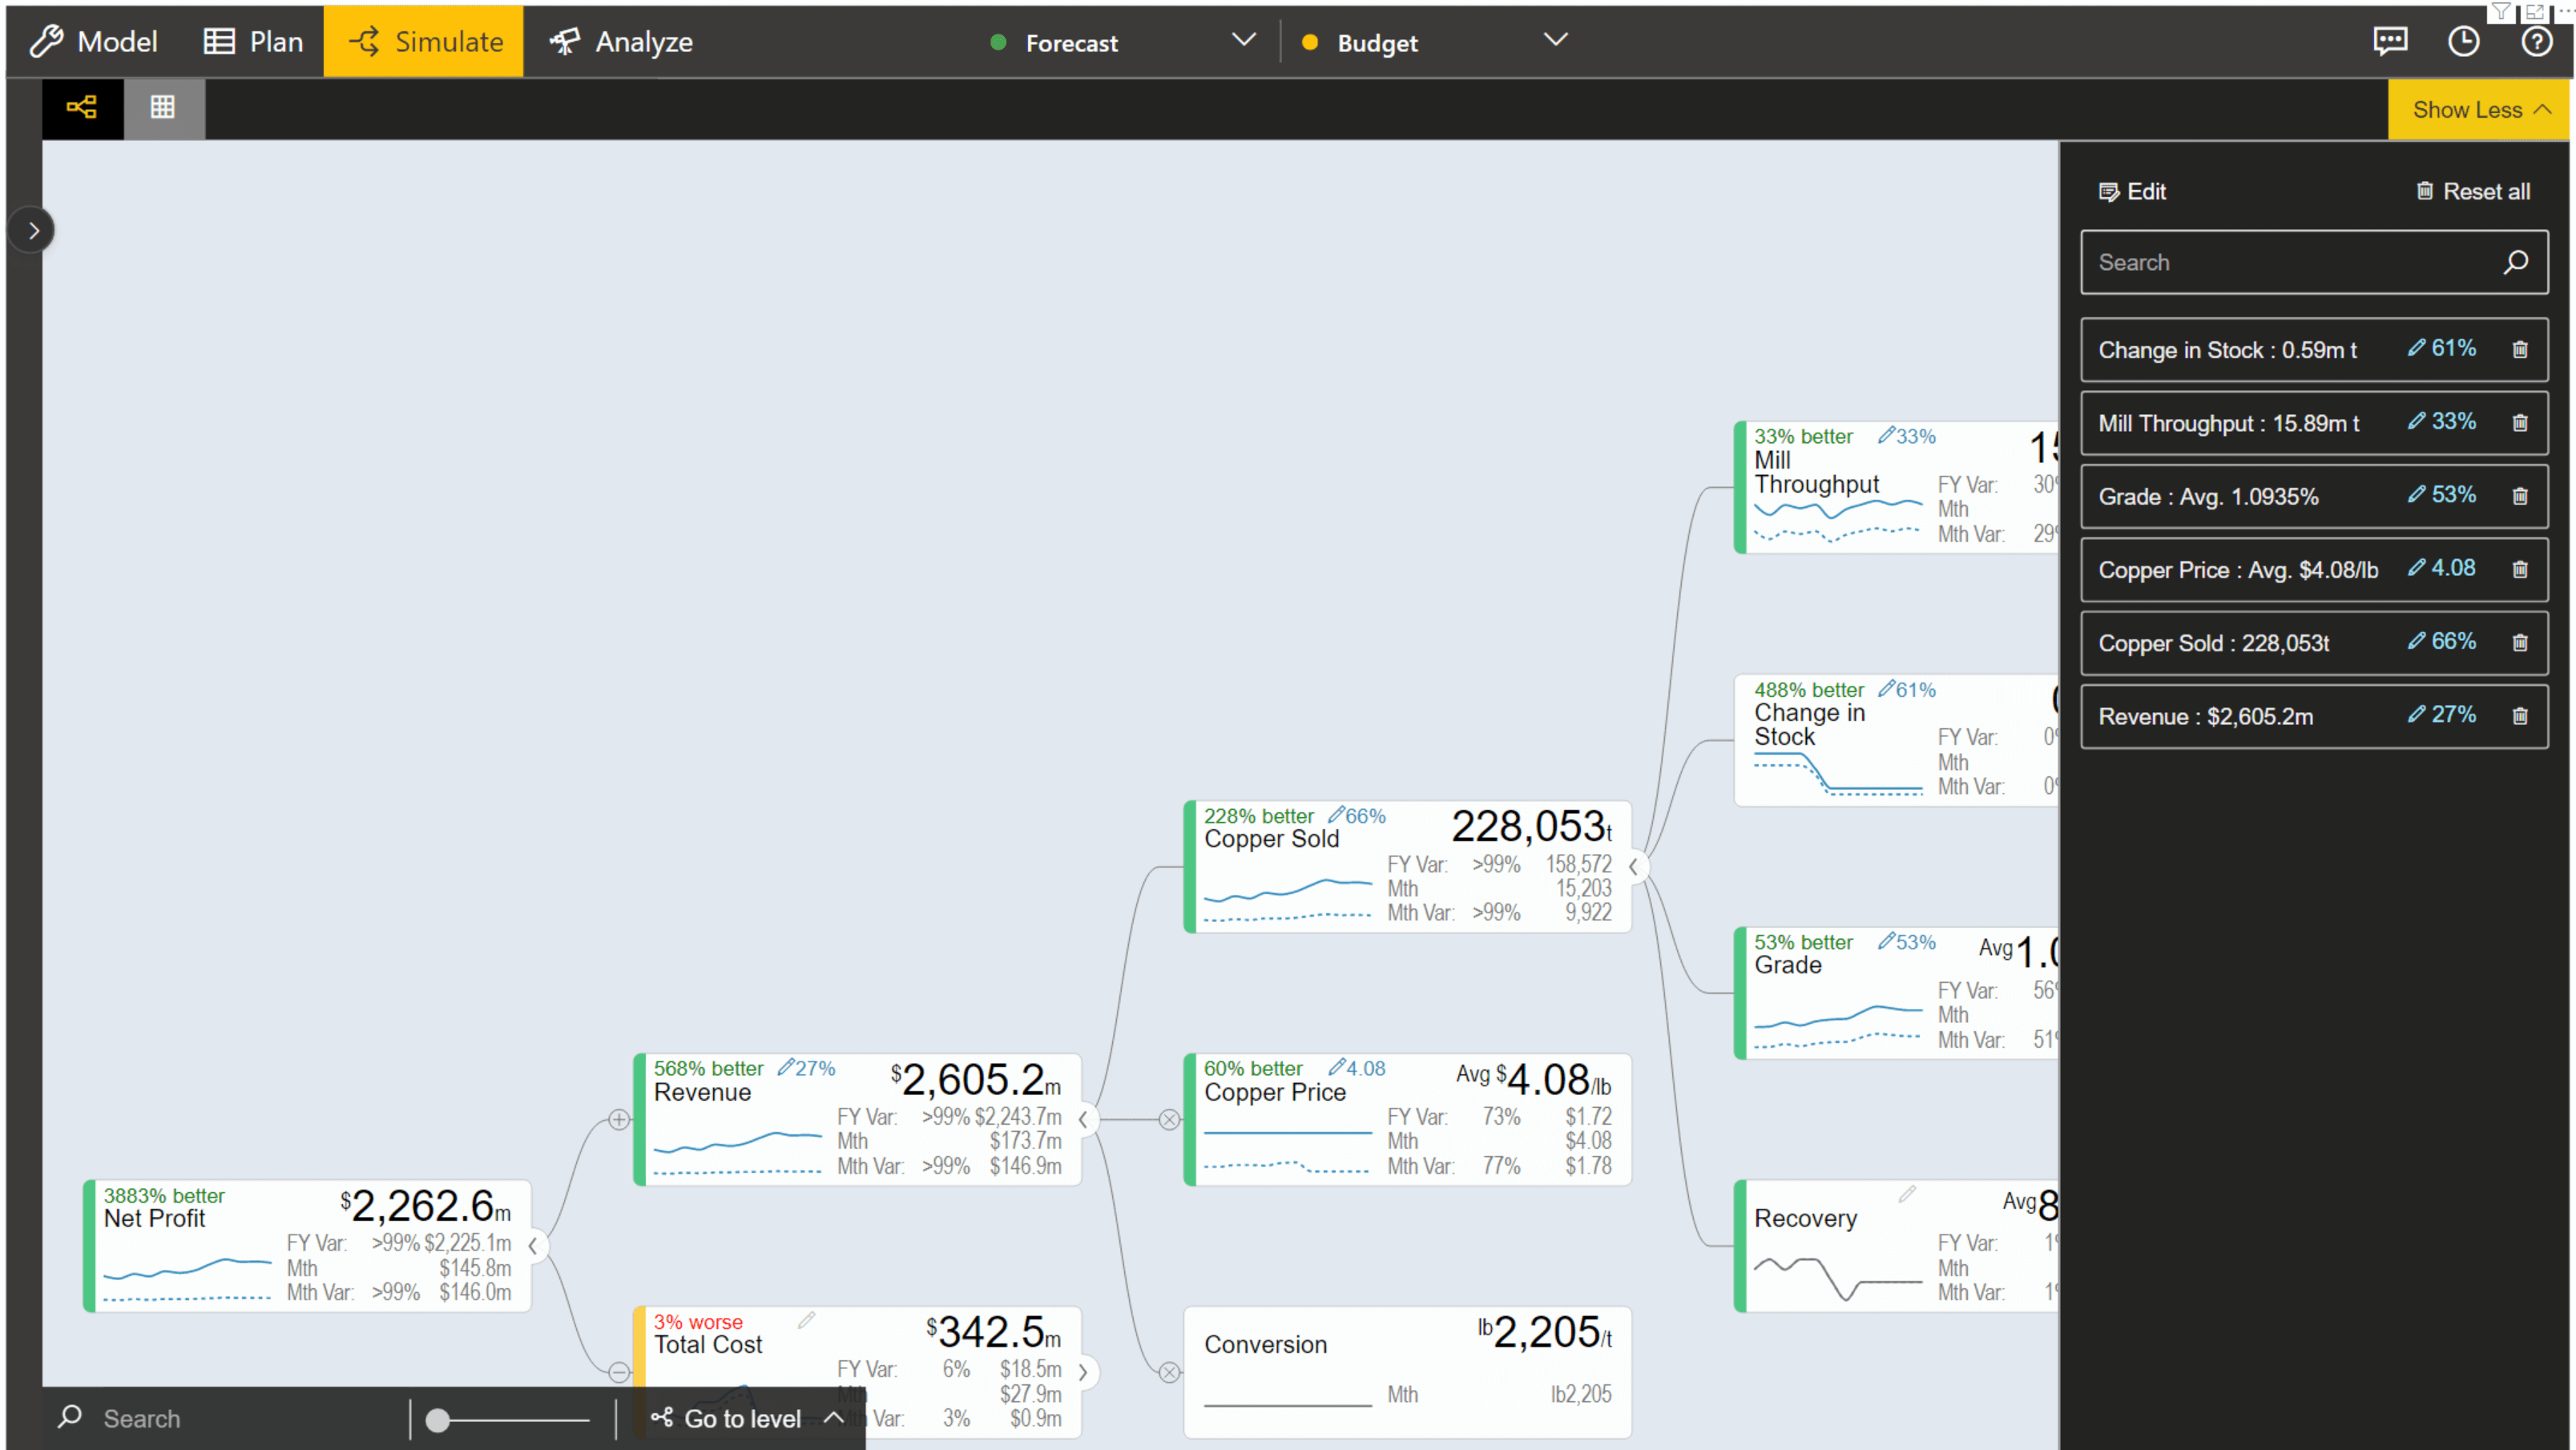
b.Multiple Simulations can now be viewed in a manner of a column. Select “Show All” in the data model, once the simulations are done.
A panel will appear in the right inclusive of all the scenarios.
c.Once a KPI has been deleted, it will no longer appear in the ‘Navigation Panel’ under ‘Simulation Tab’ and will automatically get removed.
Download the latest version here and get started with ValQ Certified Edition today.


