
The latest release of ValQ for Microsoft Power BI is packed with several new features and enhancements have the widely requested features such as time series forecasting, model merge for connected planning, scenario collaboration and many more.
Let us take a quick look at the updates and enhancements.
New features
1. Time Series Forecasting
With the introduction of Time Series Forecasting in ValQ, users would be able to evaluate till date performance and create time-series forecasts based on the historical data. ValQ provides support for Linear Trend, Moving Average and Weighted Moving Average in this version.

To learn more, read our blog Time Series Forecasting using Power BI.
2. Model Merge for Connected Planning
With this feature, it is now possible for users to merge and link different planning models. For example, the corporate FP&A model could be linked to sales forecast and headcount planning models. These connected models could be created by users from different departments or functions within the same organization. This also facilitates ease of maintenance as large models can be broken down and managed separately.
In another example below, operating profit at product sub-category and region levels are managed independently by the corresponding managers. These models are then invoked to visualize the firm’s Profit and Loss Statement.

To learn more about the model merge feature, read Merging Models in ValQ.
3. Scenario Collaboration
Scenario collaboration enables multiple users to collaborate by creating and sharing scenarios. Scenarios are classified as follows:
- Private scenarios that are accessible only by the user and not the other members of the workspace.
- Shared scenarios that are made available to all the users in the workspace.
This makes it easier to share scenarios without having to share the entire report.
An example is shown in the image below:
To learn more, read our blog Scenario Collaboration in ValQ.
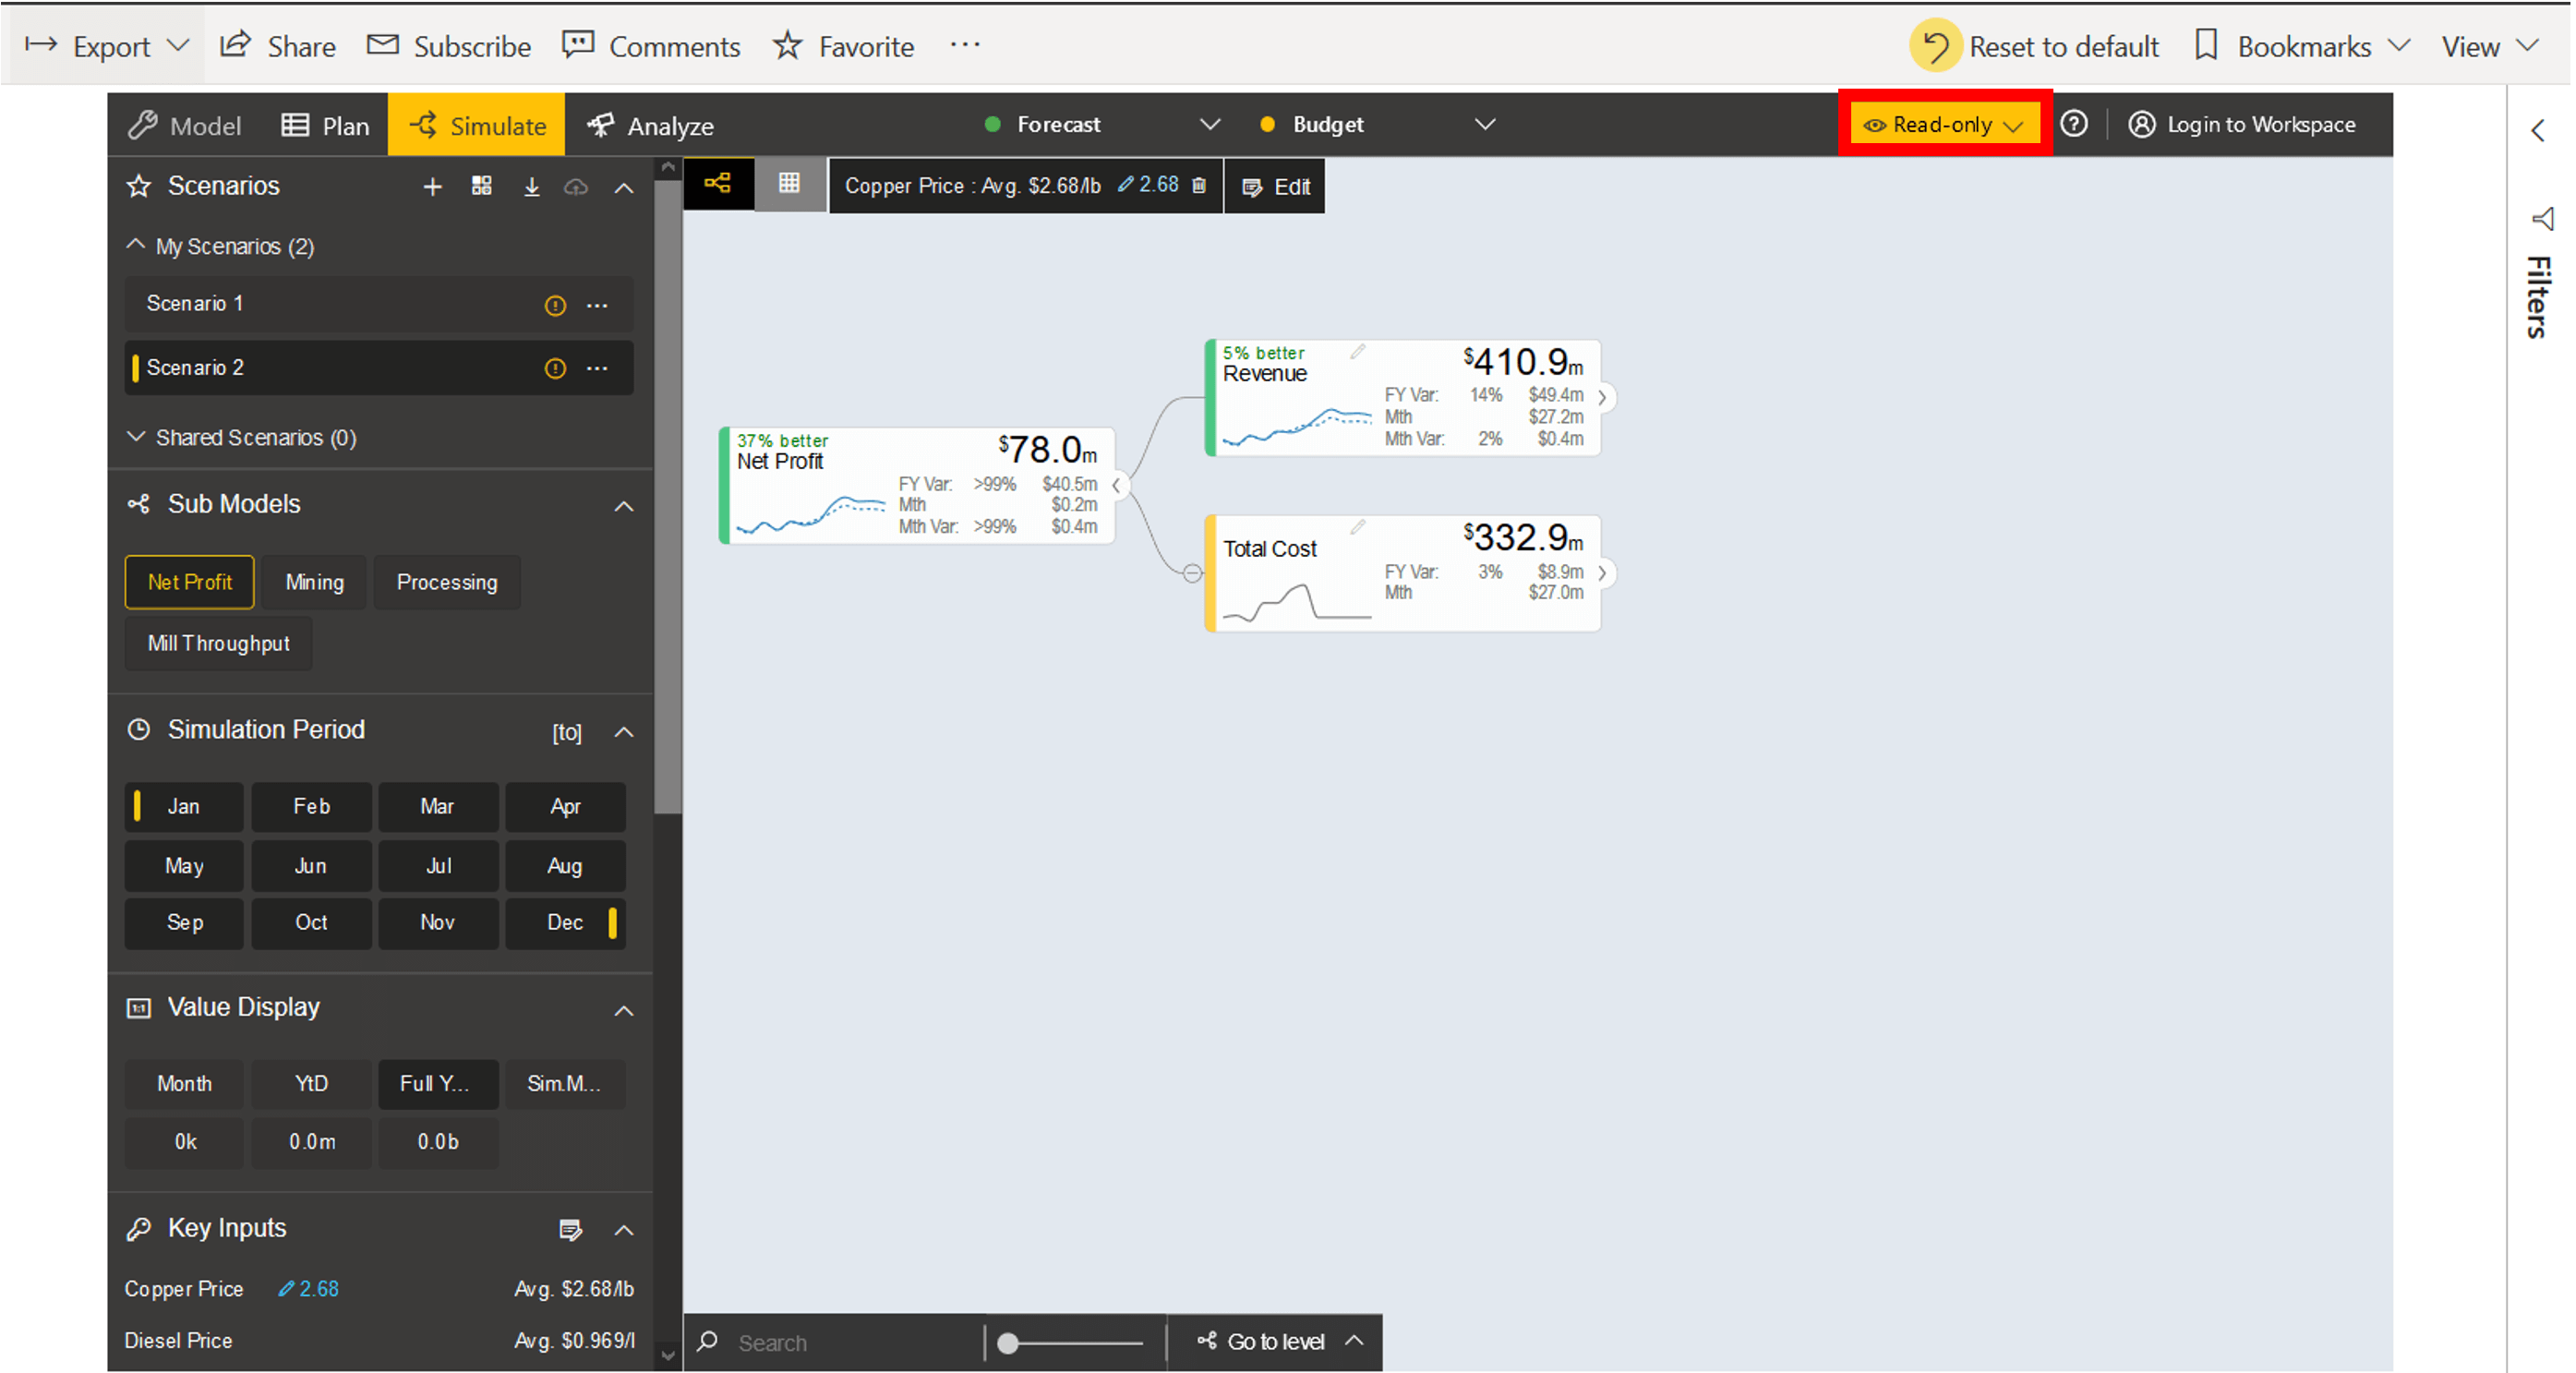
4. Read-only Mode
Read-only mode is available in the reading view of Power BI Service. With the Read-only mode, it is possible to view the visual, create and compare scenarios, perform variance analysis and more without logging into the workspace. On clicking ‘Reset to default’, scenarios created in Read-only mode will be deleted. This enables users who are not part of the workspace to view the model and perform run-time operations. However, modeling is not allowed in this mode.
To learn more, read the blog Read-only Mode in ValQ.
ValQ Enhancements
ValQ User Administration Console
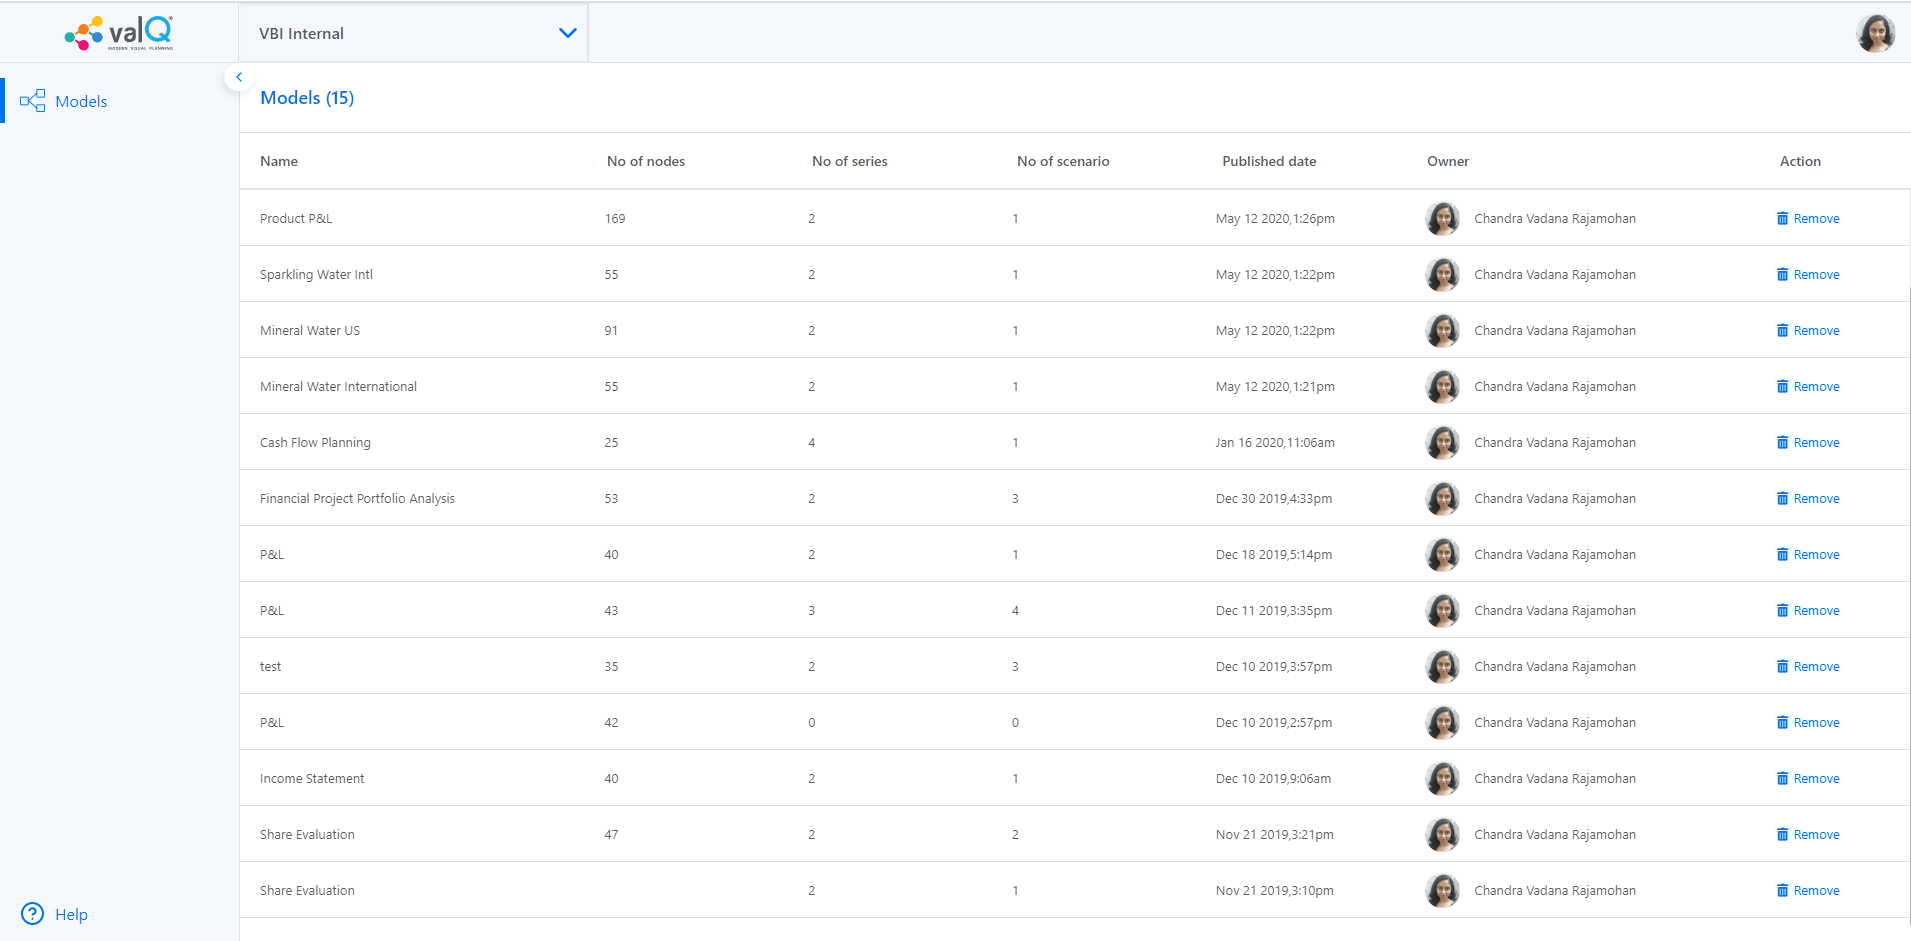
It is now possible to view the models that are saved in the workspace along with details like series/scenarios information by clicking on the ValQ console link in the visual. While members will be able to see the models they have saved, admins will be able to see all the models saved in the workspace i.e. even the models that were created by other members.
A sample member console is shown below:
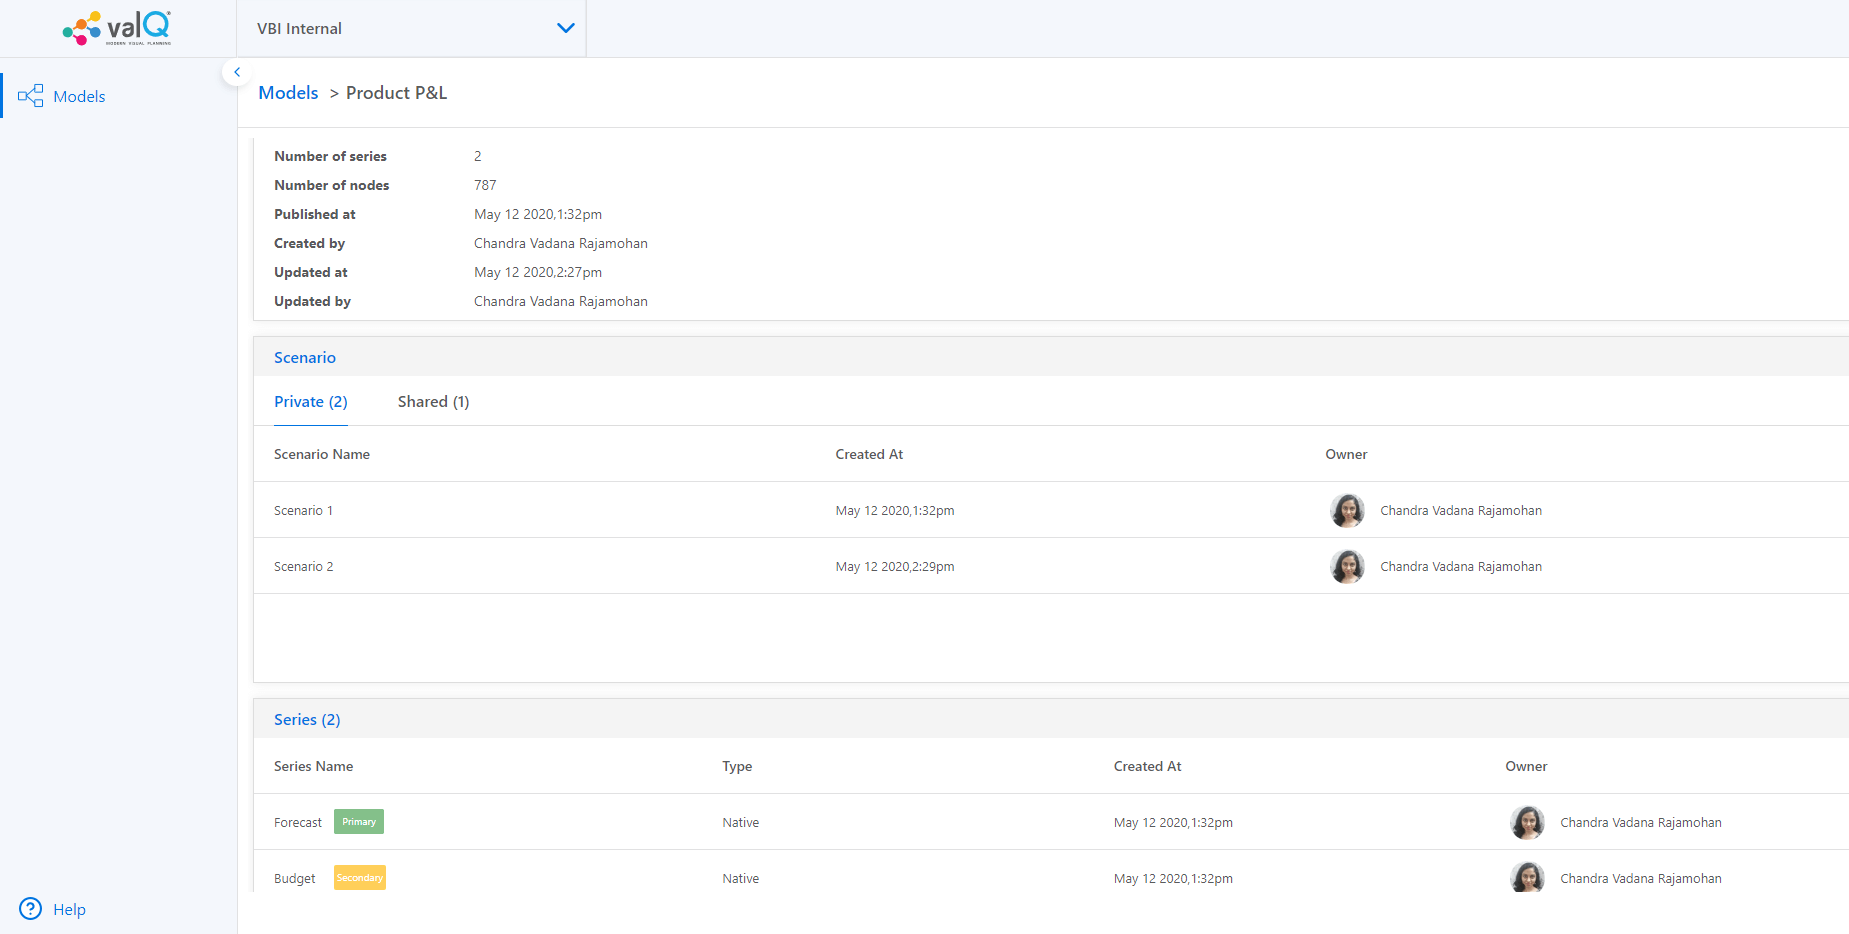
On selecting a model, more details can be viewed as shown below:
Bug fixes
- The simulation edit page is not displayed on clicking the ‘Key Inputs’ edit icon in the Navigation Panel
- Copy Scenario bug – When simulation in the copied scenario is updated, the original scenario is also getting affected
- Selection options for Compare Scenario should show shared scenarios and series
- Storage – 500 status is seen when a removed model from workspace is saved in the custom visual
- Storage – Export – Values are not correct when a template node is exported via export as a data source
- Storage – Model upload gets failed when multiple users made changes on the shared report
- Storage – Deleting scenario should update the audit log
- Storage – Scenarios in the comments drop-down is not in order
- Charts in detail page are not shown in iPad after scrolling navigation panel
- Quick Editor – Rename name is crashing the visual
- Unable to close the simulation tool tip table of the first member in the table view, Simulation Tooltip bar at the bottom is not fully visible and not able to move it up
- Slider Simulation does not work correctly in the Linked node
- Weighted average – Value is different in node and detail page on simulation
- Trend chart on the node is not displayed correctly after simulation
- When the node names are given in numbers, then not able to open the Downloaded Excel (Navigation Panel – Download)
- ‘Node Limit Exceeded’ pop up is not displayed after a limit is reached
- ‘Node Limit exceeded’ pop up should not be displayed until the user is logged in
Download the latest version here and get started with ValQ Collaborate Edition today.


